There were 4.95 billion active social media user identities in October 2023, 61.4% of the world’s population. Social users grew by 4.5% in the year ending October 2023, with growth slowing somewhat after the effects of COVID-19 and enforced lockdowns across the globe earlier this decade. People worldwide had spent much of the past two years separated from friends and family and often had to operate their businesses from home. As a result, many had to alter how they communicate with each other compared to before Covid. This led to a rapid increase in social media users in the early 2020s (double-digit annual percentage increases), but fewer new users more recently, with more than half the world already using social platforms.
This increase in social media activity has led to innovative social media marketing by many firms. Quite a few have transferred their budget from traditional channels to social media, deciding to follow their audience.
There are a few concerning social media trends, however. Engagement rates seem to be dwindling steadily, and most social platforms’ algorithms actively discriminate against posts made by business users. Also, with vast numbers already using social media, growth is inevitably slowing.
Our Social Media Benchmark Report 2024 has collated statistics and data relating to social media marketing, predominantly over the last 12 months. While recognizing the intrinsic link between social media and influencer marketing, it’s important to acknowledge the role of Influencer Marketing Platforms. We have deliberately excluded an in-depth discussion of influencer marketing in this report, reserving it for our annual State of Influencer Marketing Benchmark Report.
Social Media Marketing Benchmark Report 2024:
Social Media Adoption Surges
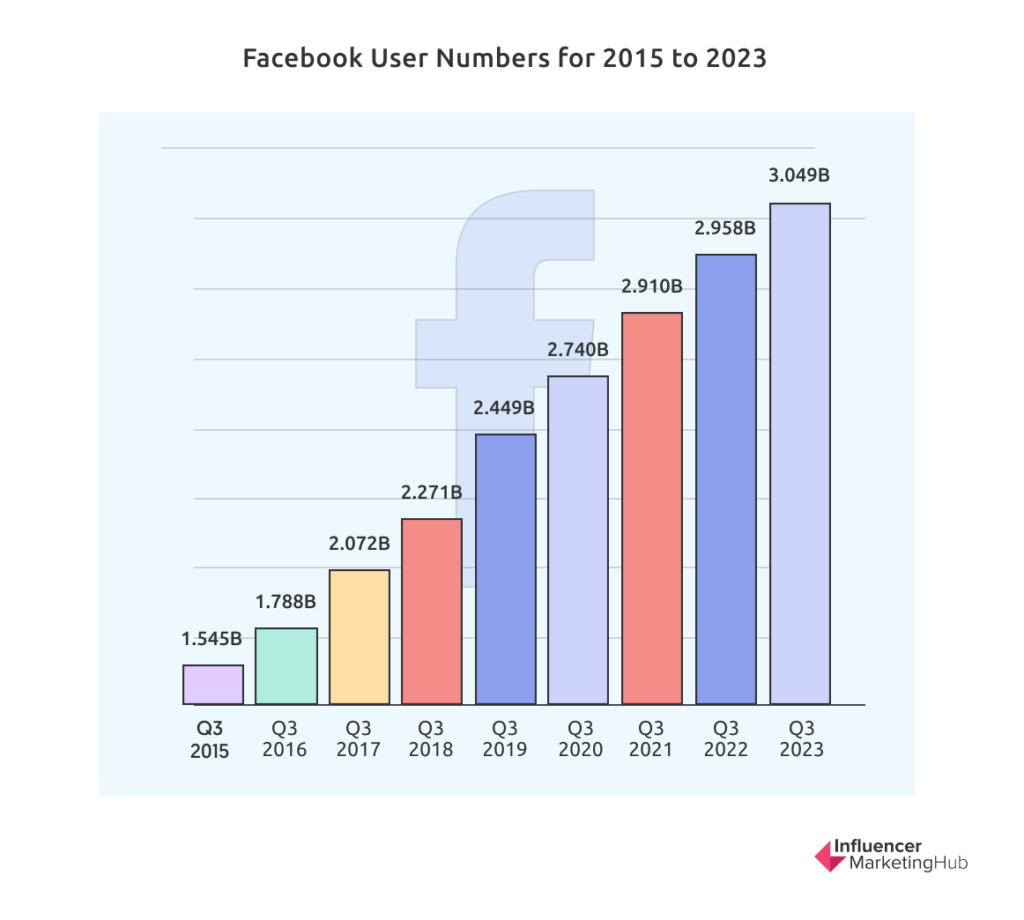
Facebook Users Nearly Doubled Between 2015 and 2023
Facebook is an established social platform, making it more popular with the older generations than many newcomers. Being the largest social platform does limit its opportunities for attracting new users. However, it still increases its user numbers each year. Facebook user numbers for 2015 to 2023 are:

Time Spent Per User Per Day on Social Media
The Average Internet User Spends Nearly 2 and ½ Hours on Social Media Per Day
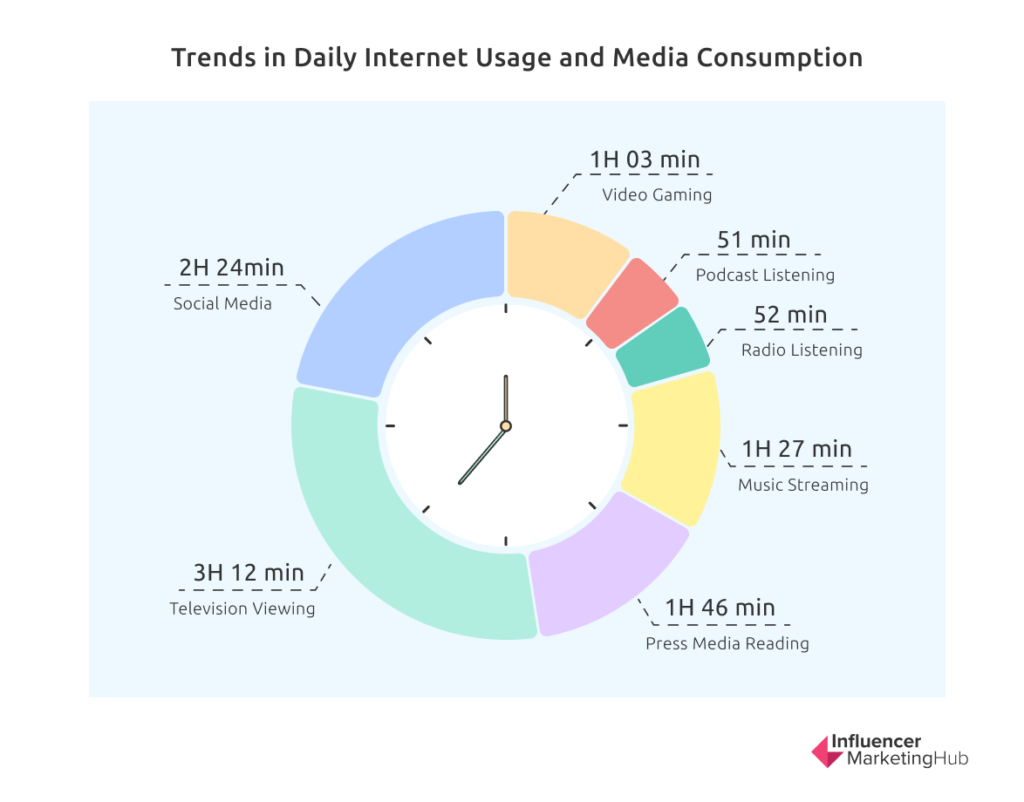
The Digital 2023 October Global Statshot looked at the average amount of time internet users aged 16 to 64 spent each day using media and devices. They found that people spend 6 hours 41 minutes on the internet across all their devices (+0.9%).
Social media is valuable to them. People spend on average 2 hours 24 minutes per day using social media (-2.5%), second only to their time watching broadcast and streaming television, 3 hours 12 minutes (-6.1%).
Other favorite internet-based activities include reading press media (1 hour 46 minutes, -17.4%), listening to music streaming (1 hour 27 minutes, -9.6%), listening to broadcast radio (52 minutes, -14.7%), listening to podcasts (51 minutes, -16.6%), and playing video games on a console (1 hour 3 minutes, -16.6%). Obviously, people carry out some of these activities simultaneously.
You will notice that although the time the average person spends on the internet has increased slightly this year, they have reduced the average time they spend on all (recreational) activities. This is clearly a sign that we are moving away from people having to fill in their time online thanks to the effects of Covid. However, it is notable that social media use has reduced at a smaller rate than all other online recreational activities over the last year.

Nigerians Spend Most Time Per Day on Social Media
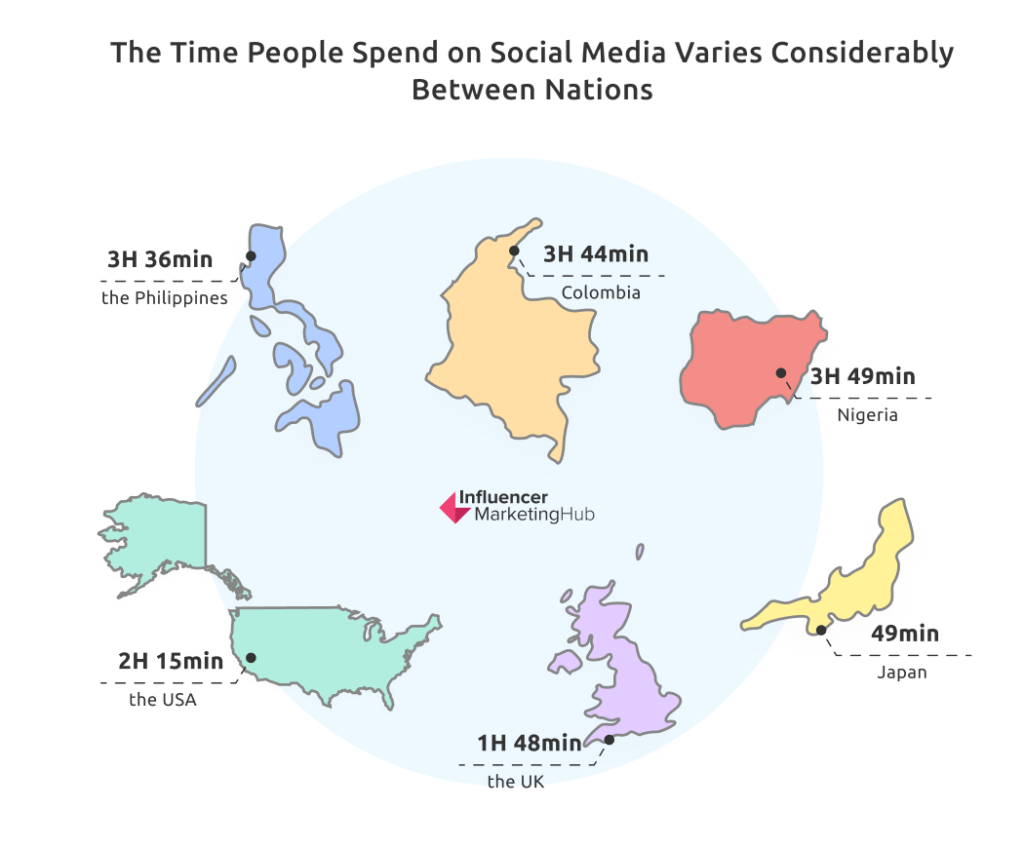
The time people spend on social media varies considerably between nations. For example, Internet users from Nigeria average 3 hours 49 minutes per day on social media activity, closely followed by second-placed Colombia (3:44). In our last edition of this benchmark report, we commented on the high social media usage of Filipinos (over 4 hours per day on average). However, this probably reflected an unusual time in the Philippines (possibly Covid-related), and that nation’s daily use is now down to 3 hours 36 minutes on average.
We may think of the USA as the king of social media, but at 2:15, its social usage is less than the global average, as is the UK’s 1:48. Likewise, Japanese residents spend considerably less time on social media than most countries, clocking in only 49 minutes per day on average. North Koreans, of course, don’t spend any (legal) time on social media, with the internet banned for its residents.

Young Females Spend Most Time on Social Media
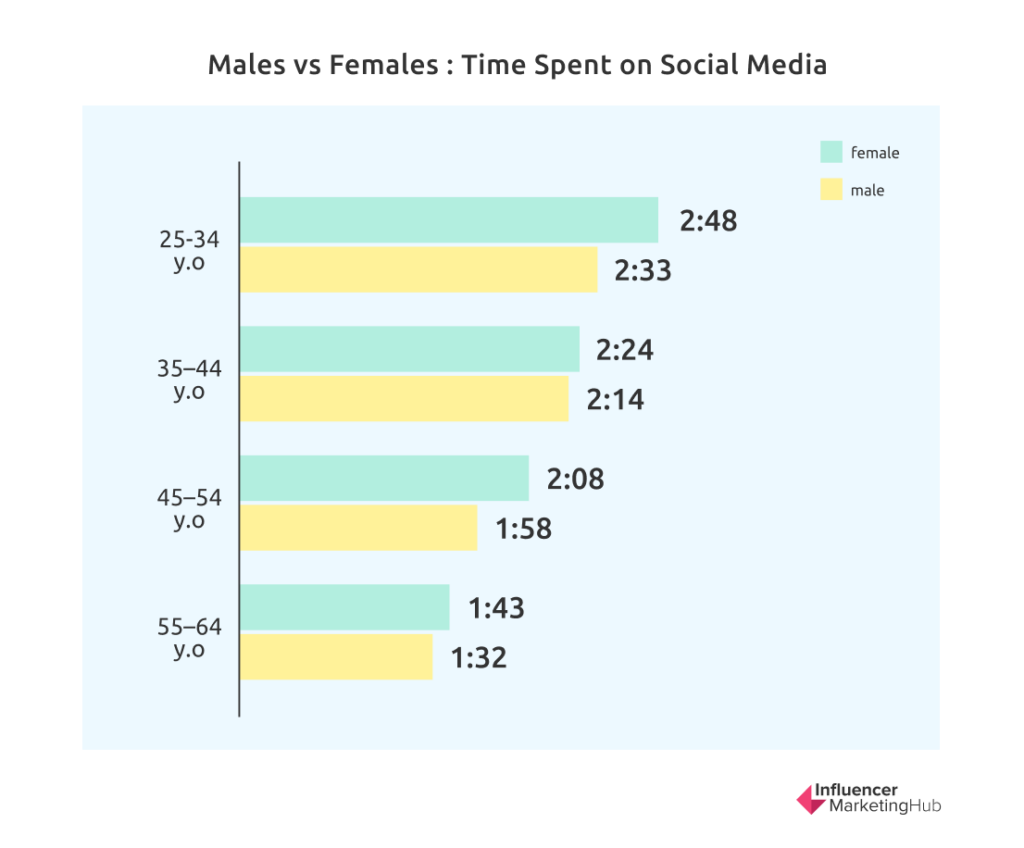
Nobody will probably be surprised by this finding. 16-24-year-old females average 3:04 per day on social media, compared to their male counterparts, who average 2:37.
The trend of females spending more time on social media continues in all subsequent age groups:

The Dominance of Social Apps
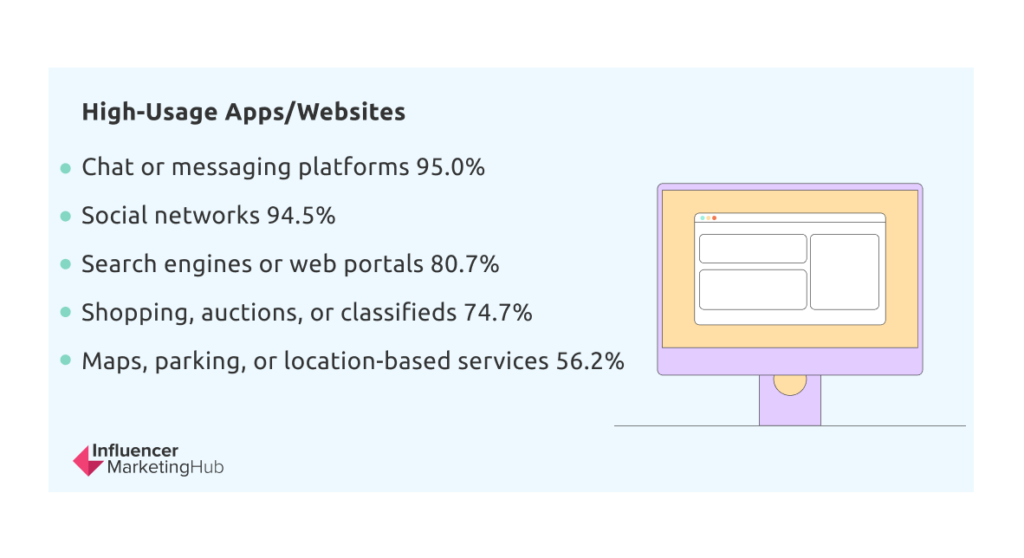
Chat / Messaging Apps and Social Networks are the Most Common Types of Website Visited / App Used
A broad survey of global internet users aged 16 to 64 found chat or messaging platforms were the most used apps/websites, followed closely by social networks. These types of apps are highly interconnected, so it’s not surprising that usage figures are similar.

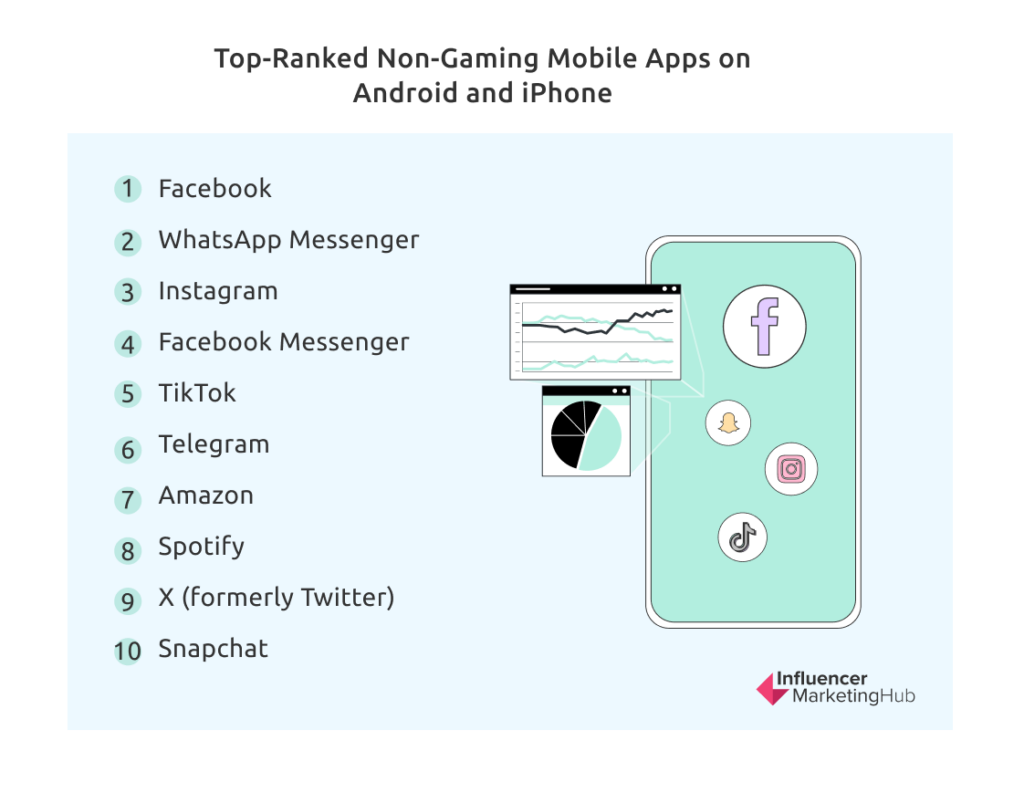
Social Apps Dominate the Non-Gaming Mobile App Rankings
Data.ai ranked mobile non-gaming apps across Android and iPhone in January 2021. Social and chat/messaging apps take up eight of the Top 10 positions in terms of monthly active users.

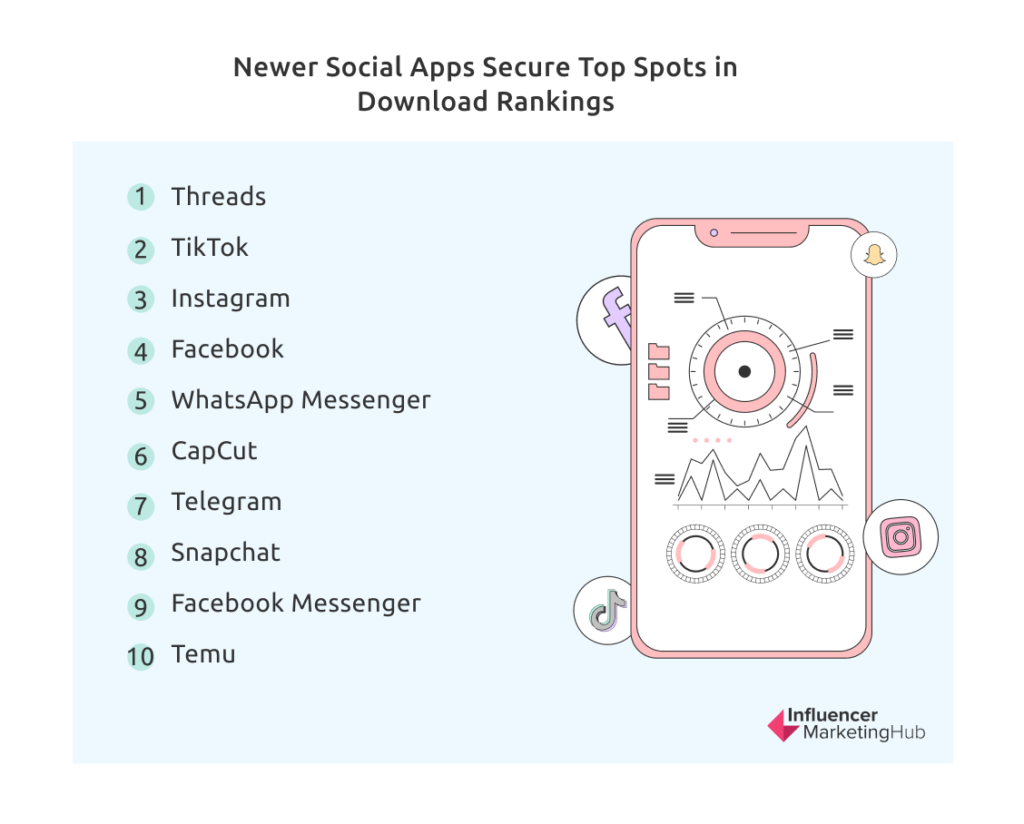
Social apps also dominated the rankings for the total number of downloads in Q3 2023. In this case, however, some of the newer social apps took higher positions in the rankings. Note that these listings ignore pre-installed apps (such as YouTube on Android phones and Safari on iPhones).

Threads and TikTok Fastest Growing Social Apps in Q3 2023
Data.ai determined the apps with the most significant quarter-on-quarter growth in worldwide downloads in Q3 2023. Threads took the top spot (from nothing, as this was its first quarter) and TikTok tenth. While not a social app, as such, ChatGPT was notably the second fastest growing non-gaming app in Q3 2023.
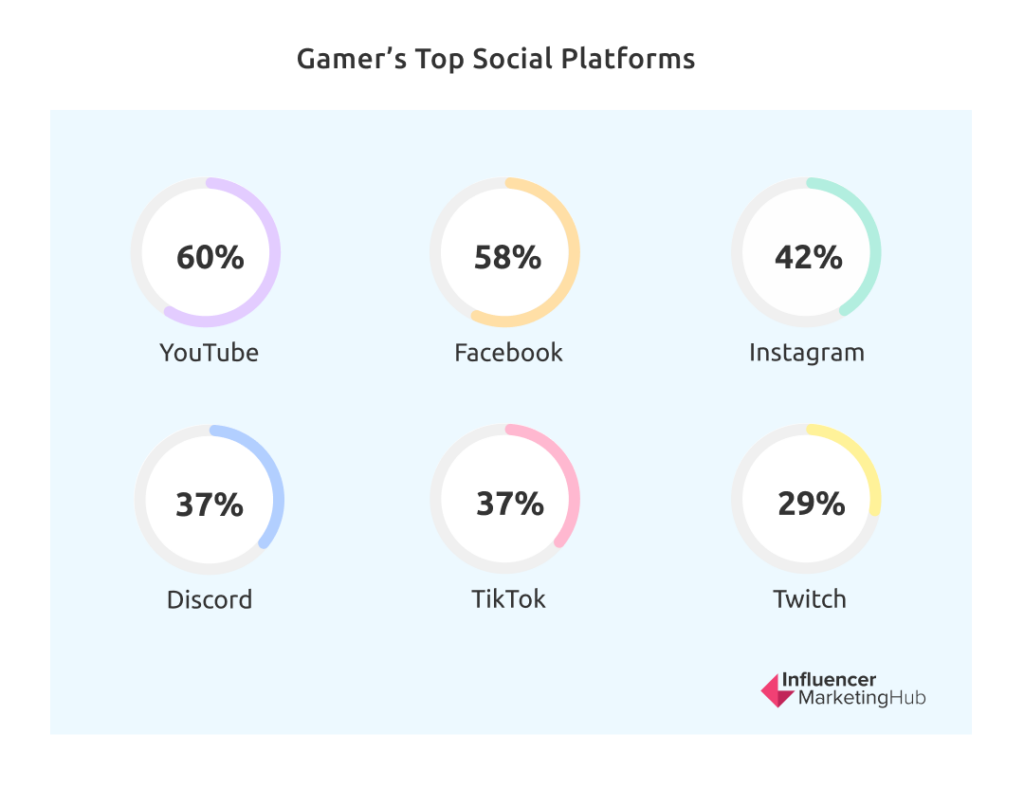
YouTube is the Social Media Preference of Choice for Gamers
Statista surveyed 1,035 gamers about gaming and eSports in the United States. One of their questions asked was about the gamers’ preferred social media platforms for information and content. 60% stated they used YouTube, followed by Facebook (58%), Instagram (42%), Discord (37%), TikTok (37%), and Twitch (29%).

Online Search Behaviors
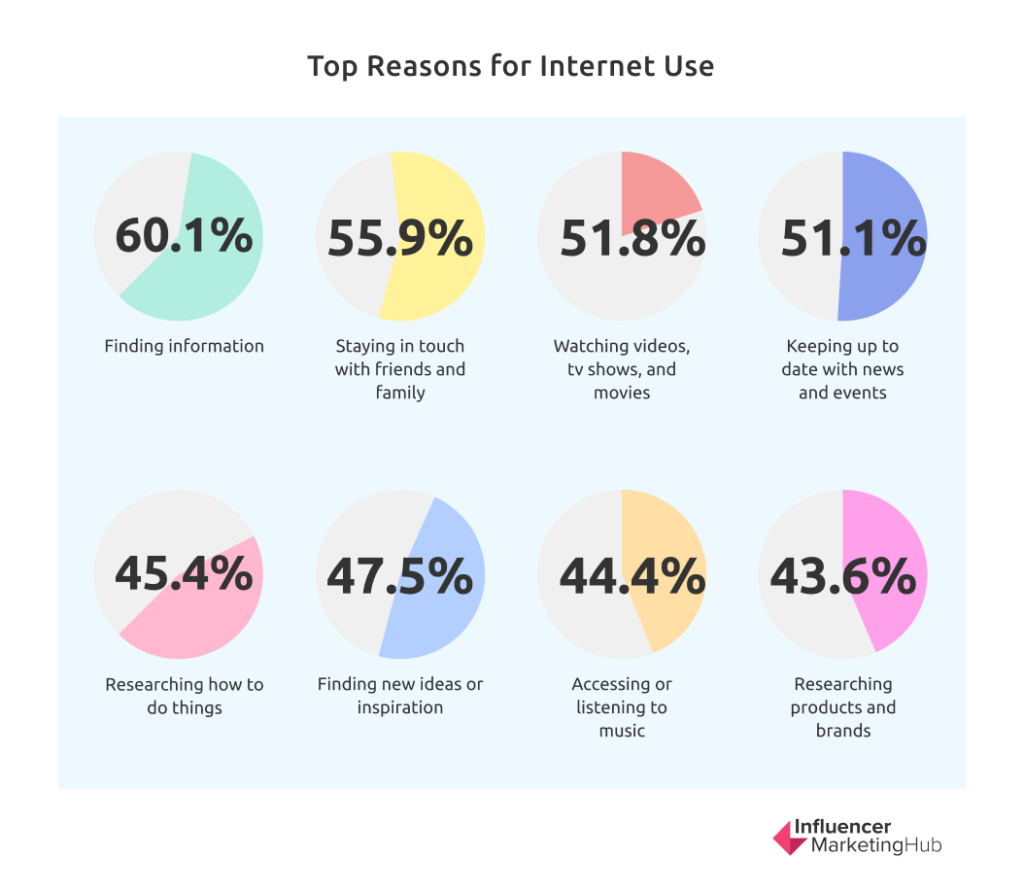
60% Use the Internet to Find Information
When asked for their primary reason for using the internet, the most common reasons given by survey respondents were:

Unsurprisingly, Google Holds a Commanding Search Engine Market Share
Google received 91.58% of global web search traffic in September 2023. The remaining web searches went through Bing (3.01%), Yandex (1.81%), Yahoo! (1.24%), Baidu (1.00%), DuckDuckGo (0.58%), Naver (0.18%), Cốc Cốc (0.14%), Sogou (0.09%), and Others (0.37%).
YouTube is the Fourth Most Searched Term on Google
Many people search for popular social media sites on Google. Indeed “YouTube” is the fourth most popular search query after “Google”, “you” and “weather”. Presumably, many of the people typing “you” are also searching for YouTube. “Facebook” takes the fifth position, “WhatsApp” seventh, “Instagram” eighth, and “Twitter” nineteenth. Twitter’s position is particularly interesting, as these figures cover the period July to September 2023, by which time Elon Musk had already renamed the app “X.”
20% of Internet Users Now Use Voice Search and More Than 25% Use Image Recognition
Although most people still use a conventional search engine on whatever device they are operating, 20% now also use voice search or voice commands.
In addition, 26.7% use image recognition tools on their mobile devices. Image recognition is particularly popular in Colombia (49.6%), Mexico (49.2%), and Brazil (48.4%).
Although these figures are considerably lower than what we reported in previous versions of this report, this is simply because GWI has revised its survey methodology, rather than because of any significant behavior change.
Primary Channels for Brand Research
73.8% of Internet Users Search for Brand Information on Social Platforms
Marketers will probably take an interest in the fact that globally 73.8% of internet users now search for brand information on social platforms.
If you separate social platforms by their different types, people conduct brand research via:
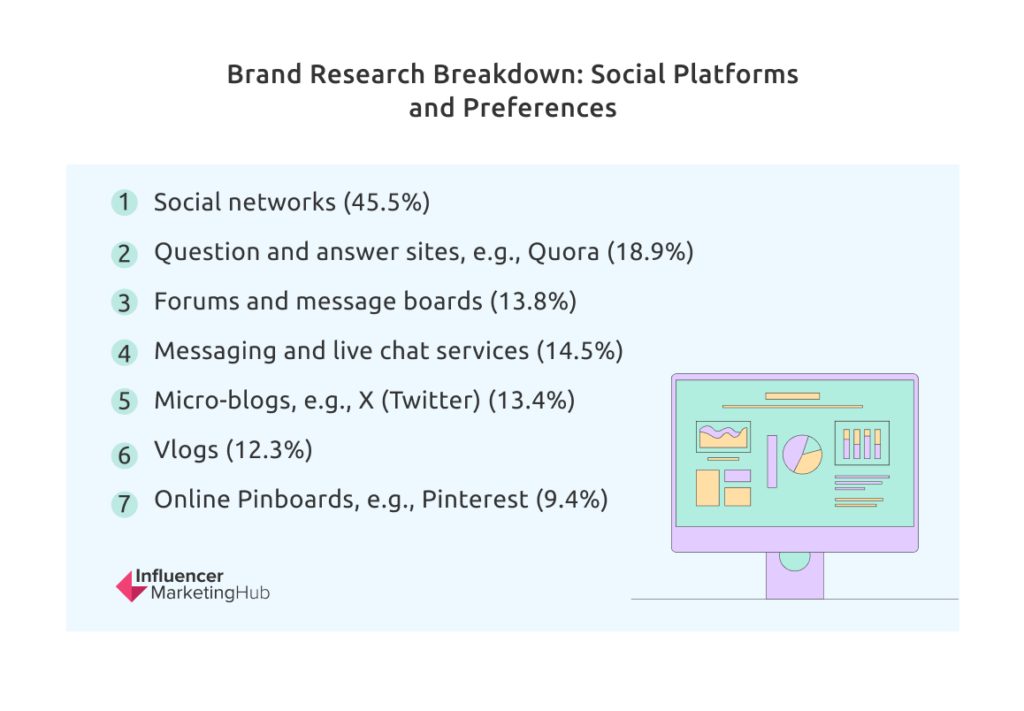

Brand research habits vary depending on where you live, however. For example, social networks are a powerful method of brand research in the African countries of Nigeria (83.9%), Kenya (76.4%), and Ghana (74.2%). They are considerably less used in South Korea (22.7%), the Netherlands (26.2%), and Japan (26.2%).
More Gen Z Use Social Networks for Brand Research Than Search Engines
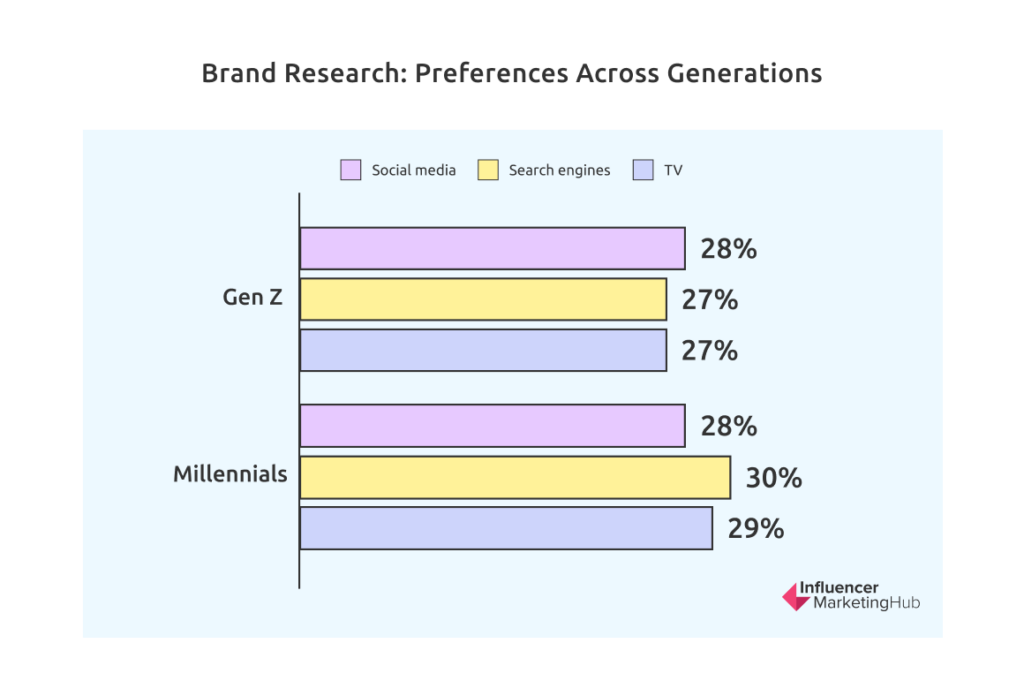
Using social networks for brand research is particularly prevalent in the younger age groups. For example, according to GWI research, Gen Z typically finds out about new products through ads on social media (28%) followed by search engines (27%), and ads seen on TV (27%).
The older generations are not yet quite as comfortable using social media for brand research, for example, Millennials typically discover new brands and products via search engines (30%), followed by ads seen on TV (29%), and ads seen on social media (28%). Social media doesn’t, as yet, appear in 35–44-year-olds claim to do so, 35.7% of 45-54 year-olds, and 28.1% of 55-64 year-olds.

Share of Web Traffic by Device
97.4% of Working Age Internet Users Own a Smartphone
Most people now use a mobile phone, and the vast majority of these are now smartphones. 97.6% of internet users aged 16 to 64 own a mobile phone of some type. 97.4% have a smartphone, and 7.3% still have non-smartphones. It is very notable that the proportion of smartphones to “feature phones” is increasing every year.


Ownership of other web-attached devices is lower but still significant. For example, as of Q2 2023, 58.6% owned a laptop or desktop computer, 32.1% a tablet device, 16.3% a TV streaming stick or device, 19.3% a games console, 16.7% a smart home device, 30.1% a smartwatch or wristband, and 4.7% a virtual reality device.
Smartphone Internet Users Make up More Than 95% of All Internet Users
With most people now owning a smartphone, it is unsurprising that, including the relatively few users of older-style feature phones, mobile internet users now make up 95.8% of total internet users.
Mobile Devices Account for 53% of Daily Internet Time
Of course, just because most people can access the web via a smartphone doesn’t mean they always do so. However, mobile usage has accounted for the majority of internet time since Q2 2019. By Q3 2020, internet users aged 16 to 64 accounted for 52.8% of total daily internet time. This has been a relatively rapid rise. People only used their mobile devices for 37.7% of their internet usage back in 2015.
Mobile Accounts for 51% of Web Traffic
Mobile has a slightly lower share when looking at the relative percentages of total web pages served to web browsers. These figures come from a different source than the previous statistic and are based on traffic to web browsers only, ignoring data for other connected activities, such as native apps.
Mobile phones accounted for 51.09% of web traffic in Q3 2023, although that was down from a peak of 59.53% in Q3 2022. Laptops and computers accounted for a still considerable 44.95%, and this represented a 14.5% year-on-year increase. Less dominant were tablet computers (a mere 1.83% and dropping every year) and other devices, such as game consoles (0.40%.)
95% of the Unconnected Live in Low and Middle-Income Countries
Many countries now have higher total 3G, 4G, and 5G connections than their population. Other parts of the world are sadly lacking in mobile connectivity. Sub-Saharan Africa remains the region with the largest coverage and usage gaps. In low and middle-income countries (LMICs), adults in rural areas are 29% less likely to use mobile internet than those in urban areas, while women are 19% less likely to use mobile internet than men. In the least developed countries (LDCs), only 25% of the population uses mobile internet, compared to 52% across LMICs overall and 85% in high-income countries.
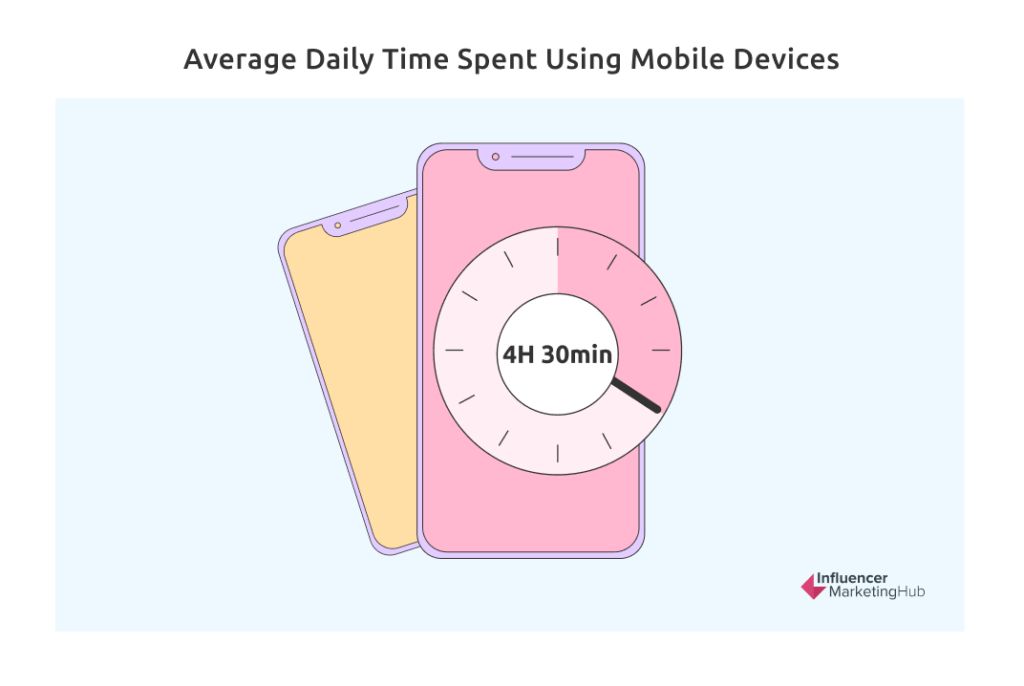
The Average Person Uses Mobile Devices for More Than 4 Hours 30 Minutes Each Day
Statista reports that the average time spent daily on a phone, not counting talking on it, has increased in recent years, reaching a total of 4 hours and 30 minutes as of April 2022. Predictions are that this figure will reach around 4 hours and 39 minutes by 2024.
We can look at this figure alongside data from the Digital 2023: October Global Statshot Review showing various average daily times spent with media (on all devices):
- Time spent using the internet 6 hours 41 minutes
- Time spent watching television (broadcast and streaming) 3 hours 12 minutes
- Time spent on social media 2 hours 24 minutes
- Time spent reading press media (online and physical print) 1 hour 46 minutes
- Time spent listening to music streaming services 1 hour 27 minutes
- Time spent listening to broadcast radio 0 hours 52 minutes
- Time spent listening to podcasts 0 hours 51 minutes
- Time spent using a games console 1 hour 3 minutes

The Most Used Social Platforms
Facebook Dominates Social Platform User Numbers
Unfortunately, most social platforms only publish user numbers when they reach milestones, so user figures are not directly comparable because they are announced at different times. However, these figures still indicate the approximate global active user figures for the most popular platforms.
Despite no longer being the trendy child of social media, Facebook still has the most users by some margin. They reported having 3.05 billion users in Q3 2023.
The second most popular platform, YouTube, has significantly benefited from the increased popularity of streaming and downloadable video in recent times. Indeed, many YouTube users may not even think of the platform as social media, as they merely choose to consume videos, much as they do Netflix. Nevertheless, they have 2.491 billion users.
The third platform to reach 2 billion users (just) are two other Meta-owned apps WhatsApp and Instagram. Facebook Messenger (1.036 billion) is another highly popular Meta app, although it has dropped to seventh place in the rankings (although there are suggestions that this number underestimates actual usage of the platform for technical reasons).
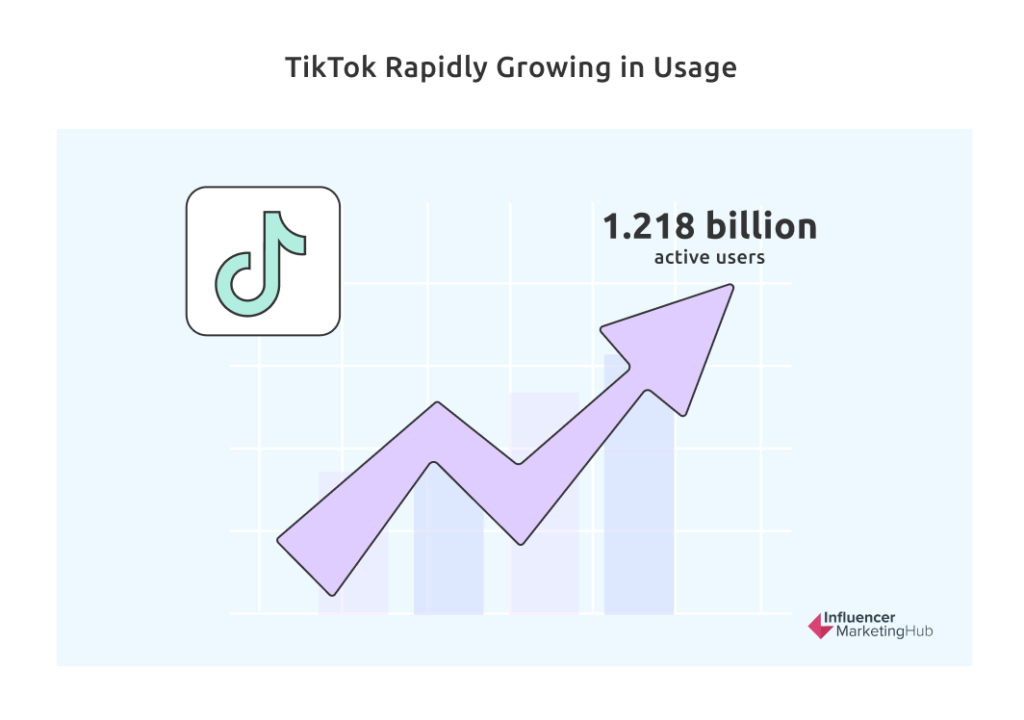
WeChat (1.327 billion users) and TikTok (1.218 billion) have both increased in popularity recently to hold the fifth and sixth places in the rankings.
With four of the top social platforms, Meta can genuinely claim to dominate social media user numbers. In the third quarter of 2023, Meta reported over 3.96 billion monthly core Family product users (i.e., people using at least one of Facebook, WhatsApp, Instagram, or Messenger) each month.
TikTok Rapidly Growing in Usage
A few years ago, TikTok was merely a small Chinese video-sharing and social app that then merged with the moderately popular app, Musical.ly. However, it has multiplied in popularity over the last few years, to the point where TikTok now has 1.218 billion active users. This makes it the sixth most popular social platform and well ahead of other well-known social media, such as Pinterest (465 million active users), Snapchat (750 million users), and X (Twitter) (666 million users).

Facebook Users Average More Than 33 Hours/Month on the Android App
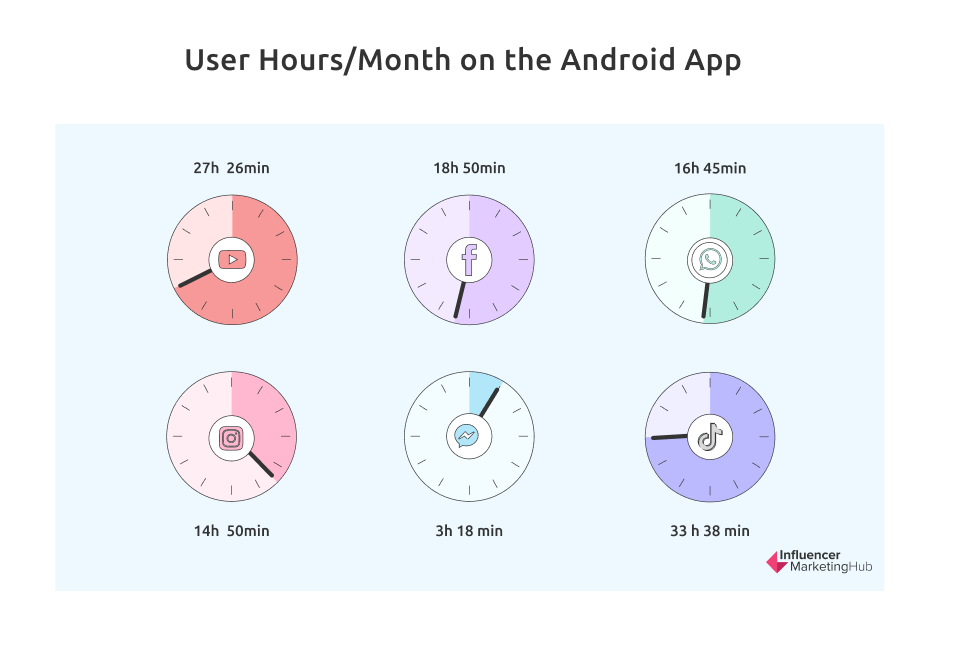
In previous versions of this benchmark report, we reported that Meta (Facebook) products dominated the average time per month users spend on their apps – and people still use them (almost) as much as ever. Facebook users now average 18 hours 50 minutes per month, closely followed by What’s App users (16 hours 45 minutes per month) and Instagram (14 hours 50 minutes). Facebook Messenger users, however, only average 3 hours 18 minutes per month (similar to Snapchat usage).
You might have noticed, however, that TikTok has risen through the ranks over the last couple of years, and its users now average an astounding 33 hours and 38 minutes on the app each month.
Notably, although there are many Facebook Messenger users, as we have seen above, they spend considerably less time in that app than on the other Facebook-owned social platforms, averaging 2.7 hours/month.
YouTubers Average More Than 27 Hours Hours/Month on the Android App
With many people treating YouTube like an on-demand television service, it is unsurprising that their users average 27 hours 26 minutes per month (on their Android apps, at least). Of course, as good as this is, it is still less time than TikTokers spend on that app.

Online Audience Demographics
Facebook Users are Predominantly Mobile Phone Users – 81.8% Only Have Access to a Mobile Phone
There is now a solid correlation between Facebook users and mobile phone owners, despite Facebook being one of the social platforms most likely to attract older people. Indeed, 98.5% of Facebook users access the social app via a mobile phone. Furthermore, 81.8% of Facebook users have no choice – they can only use a mobile phone for access.
It is notable how few Facebook users have access to a computer nowadays. Only 1.5% access Facebook exclusively via a laptop or desktop computer, and 16.7% use a mix of their phone and a computer.
These statistics relate to Facebook users aged 18 and over. The percentage relying on mobile phones for access would be even higher if you counted Facebook users younger than 18.
Males Use Social Media More Than Females Globally, But There Is Considerable Variation Between Countries
Globally, 53.6% of social media users are male compared to 46.4% female. However, these ratios differ markedly between countries.
Female users outnumber males in most developed countries, for example, Northern America (49% male, 51% female), and Eastern Europe (47% male, 53% female. In Northern Europe, Southern Europe, Western Europe, the Caribbean, Southern Africa, and Oceania there is an even 50:50 split between males and females. However, social media is very much male-dominated in many highly populated developing areas, such as Southern Asia (67% male, 33% female), Western Asia (60% male, 40% female), Western Africa (61% male, 39% female), and Northern Africa (60% male, 40% female). However, it is notable that the percentage of females using social media in all these developing areas has increased since the last edition of this report.
Young Females Spend Most Time Using Social Media
This is probably one of the least surprising findings in this benchmark report. The Exploding Topics found that females aged 16-24 averaged 3 hours, and 4 minutes on social media each day, compared to their male counterparts who spent 2 hours 37 minutes socializing online daily. However, both these figures are down since last year’s report.
Social media use decreases with the older generations, but in all cases, females spend more time using their social apps than males. Notably, (unlike the youngest survey respondents), social media time increased for all these age groups:
- 25–34-year-olds: Females 2:48, Males 2:33
- 35–44-year-olds: Females 2:24, Males 2:14
- 45–54-year-olds: Females 2:08, Males 1:58
- 55–64-year-olds: Females 1:43, Males 1:32
Half of Facebook’s Users Speak English
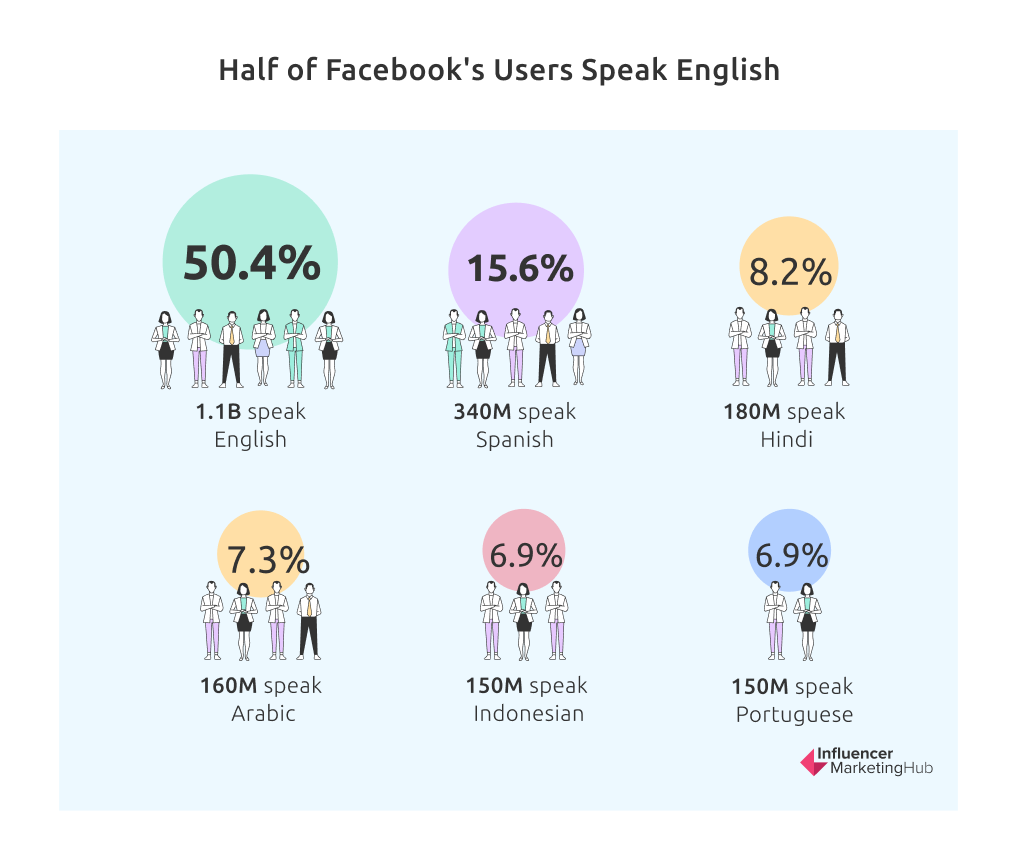
1.1 billion people (50.4% of Facebook’s global advertising audience) can speak English. Other languages regularly spoken by Facebook users include Spanish (340 million, 15.6%), Hindi (180 million, 8.2%), Arabic (160 million, 7.3%), Indonesian (150 million, 6.9%), and Portuguese (150 million, 6.9%).

There are More Facebook Users in Dhaka Than Anywhere Else
Facebook has signposted the cities where it has the most active users. Dhaka tops the list, with 14.8 million active users, in the city, expanding to 20.55 million in a 40km radius. Other large cities where Facebook is popular include Delhi (12.95 million / 20.2 million), Bangkok (10.45 million / 15.8 million), Ho Chi Minh City (9.9 million / 15.75 million) Lima (9.35 million / 10.55 million) and Mexico City (9.25 million / 16.65 million).
Social Media Platforms Advertising Reach
Note that many of the social media platforms have changed the way they record figures recently. This means that you shouldn’t compare results in this section with previous versions of this Benchmark report.
Young Females Spend Most Time Using Social Media for Brand Research
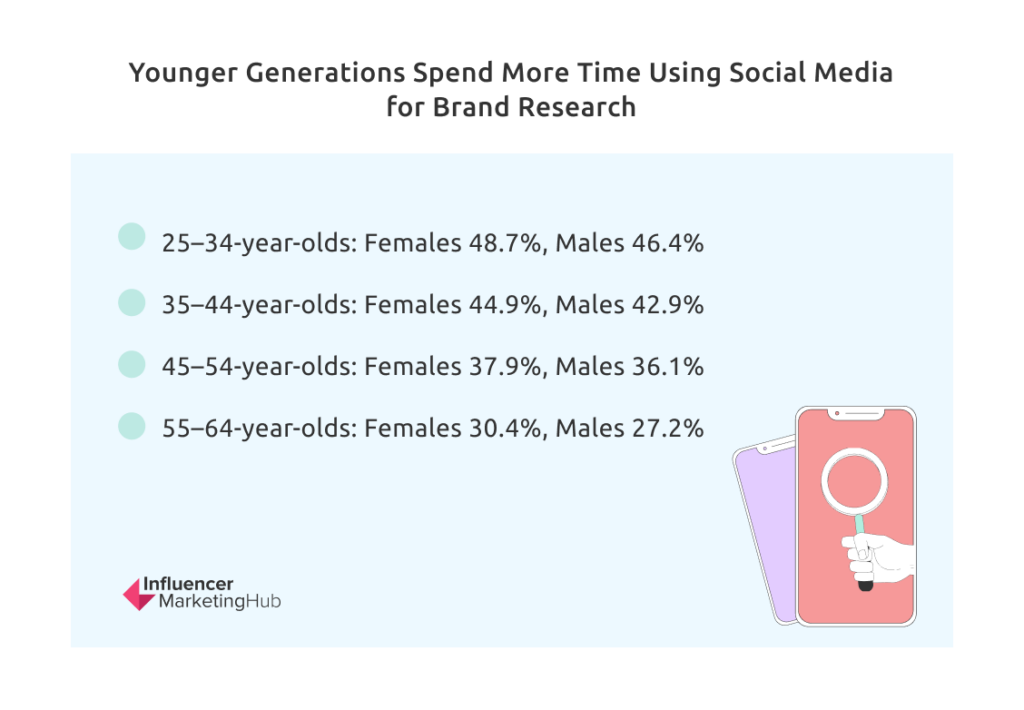
When you look at the use of social media for brand research, you see a similar demographic pattern to that of social media as a whole. The highest social media users for brand research are 16-24-year-old females (50.1%), followed by their male counterparts (46.1%). Both these figures are notably down on those we included in last year’s report, however – a trend not obvious for other age groups.
The use of social media for brand research drops slightly with older generations, although there is a close balance between the genders in each age group:

Facebook Ads Can Potentially Reach 39.0% of the Total Population of 18+
While few brands would consider targeting every Facebook user, they could potentially reach 2.31 billion Facebook user accounts. That potential advertising audience is equivalent to 39.0% of the global population aged 18+. In addition, Facebook’s advertising reach grew 3.4% in the quarter ending October 2023.
Facebook reports that 56.8% of its global ad audience is male, with 43.2% female.
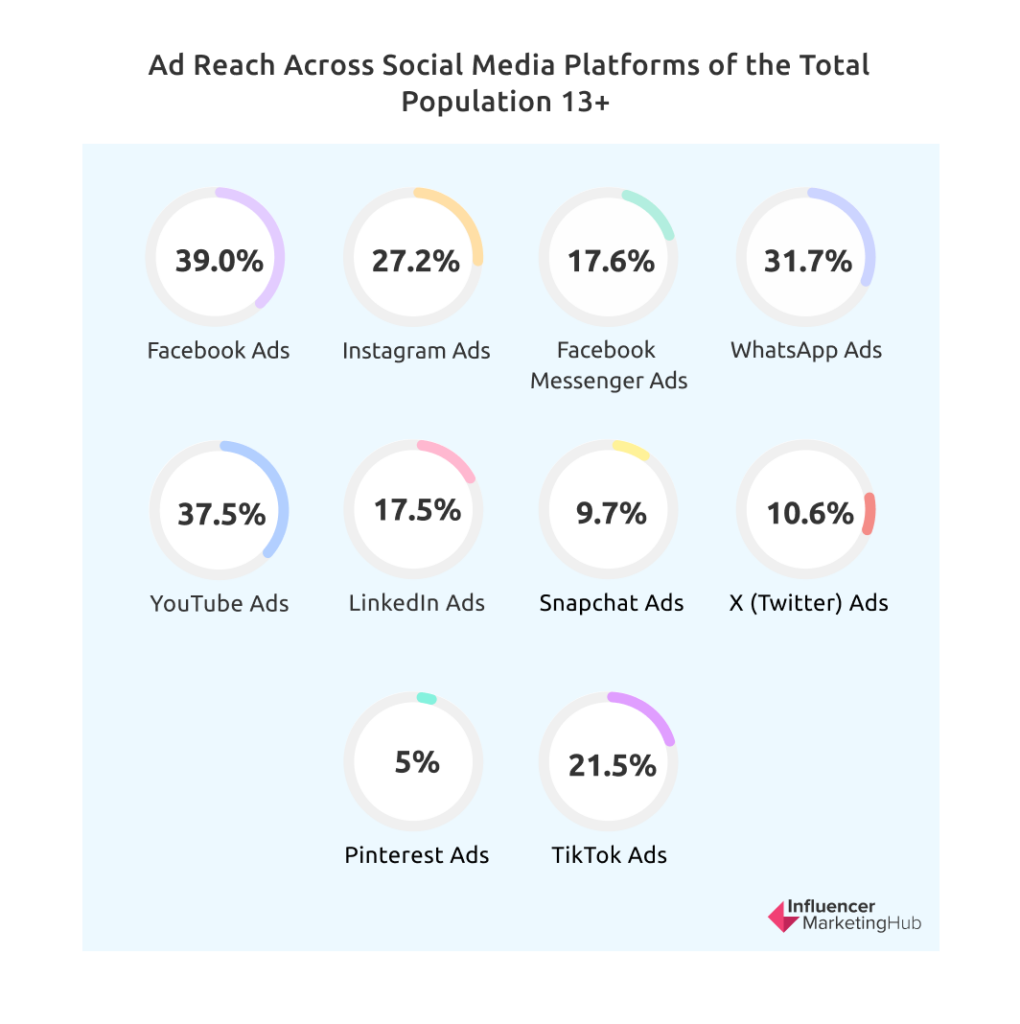

Instagram Ads Can Potentially Reach 27.2% of the Total Population of 18+
Instagram’s potential advertising audience is 1.64 billion people worldwide. That is equivalent to 27.2% of the global population aged 18+. Their advertising reach grew 2.5% in the quarter ending October 2023.
Meta reports that 50.3 of Instagram’s global ad audience is male, with 49.7% female.
Facebook Messenger Ads Can Potentially Reach 17.6% of the Total Population 18+
Facebook Messenger’s potential advertising audience is 1.04 billion people worldwide. That is equivalent to 17.6% of the global population aged 18+. Their advertising reach fell 0.2% in the quarter ending October 2023, although numbers have fluctuated over 2021-2023.
Facebook reports that 55.7% of Messenger’s global ad audience is male, with 44.3% female.
WhatsApp Ads Can Potentially Reach 31.7% of the Total Population of 13+
WhatsApp’s potential advertising audience is equivalent to 31.7% of the global population aged 13+. (Note the difference in age here, compared to the other social media platforms).
Meta reports that 52.8% of WhatsApp’s global ad audience is male, with 47.1% female.
YouTube Ads Can Potentially Reach 37.5% of the Total Population of 18+
YouTube’s potential advertising audience is 2.49 billion people worldwide. That potential advertising audience is equivalent to 37.5% of the global population aged 18+. YouTube’s advertising reach fell 1.4% in the quarter ending October 2023. Peak advertising reach was in the first half of 2022.
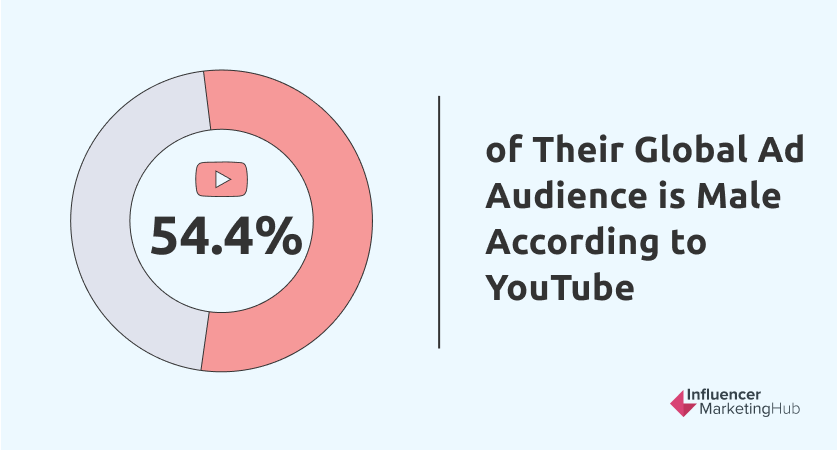
YouTube reports that 54.4% of its global ad audience is male, with 45.6% female.

LinkedIn Ads Can Potentially Reach 17.5% of the Total Population of 18+
LinkedIn’s potential advertising audience is 989.7 million people worldwide. That potential advertising audience is equivalent to 17.5% of the global population aged 18+. Their advertising reach rose 3.3% in the quarter ending October 2023.
LinkedIn reports that 56.6% of its global ad audience is male, with 43.4% female.
Snapchat Ads Can Potentially Reach 9.7% of the Total Population of 18+
Snapchat’s potential advertising audience is 676.0 million people worldwide. That potential advertising audience is equivalent to 9.7% of the global population aged 18+. Their advertising reach rose 0.02% in the quarter ending October 2023.
Snapchat reports that 49.5% of its global ad audience is male, with 49.7% female.
X (Twitter) Ads Can Potentially Reach 10.6% of the Total Population of 13+
X (Twitter)’s potential advertising audience is 666.2 million people worldwide. That potential advertising audience is equivalent to 10.6% of the global population aged 13+ (Note the difference in age here compared to the other social media platforms). Their advertising reach rose 18.1% in the quarter ending October 2023. Please note, however, that Kepios Analysis has observed significant anomalies in the data reported by X over 2023, e.g. the change in advertising reach over the first three quarters of the year have been -32.9%, +51.3%, and +18.1%.
X reports that 61.2% of its global ad audience is male, with 38.8% female.
Pinterest Ads Can Potentially Reach 5.0% of the Total Population of 18+
Pinterest’s potential advertising audience is 310.1 million people worldwide. That potential advertising audience is equivalent to 5.0% of the global population aged 18+. Their advertising reach rose 5.6% in the quarter ending October 2023.
Pinterest reports that 17.0% of its global ad audience is male, with 79.5% female.
TikTok Ads Can Potentially Reach 21.5% of the Total Population of 18+
TikTok’s potential advertising audience is 1.22 billion people worldwide. That potential advertising audience is equivalent to 21.5% of the global population aged 18+. TikTok advertising reach grew 12.6% in the quarter ending October 2023.
TikTok reports that 50.8% of its global ad audience is male, with 49.2% female.
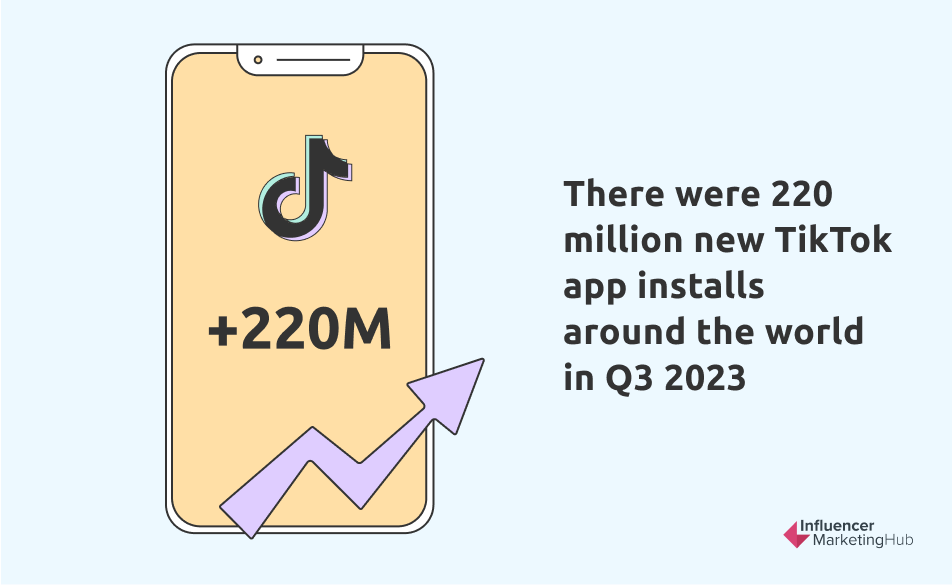
There were 272.7 million new TikTok app installs around the world in Q3 2023.

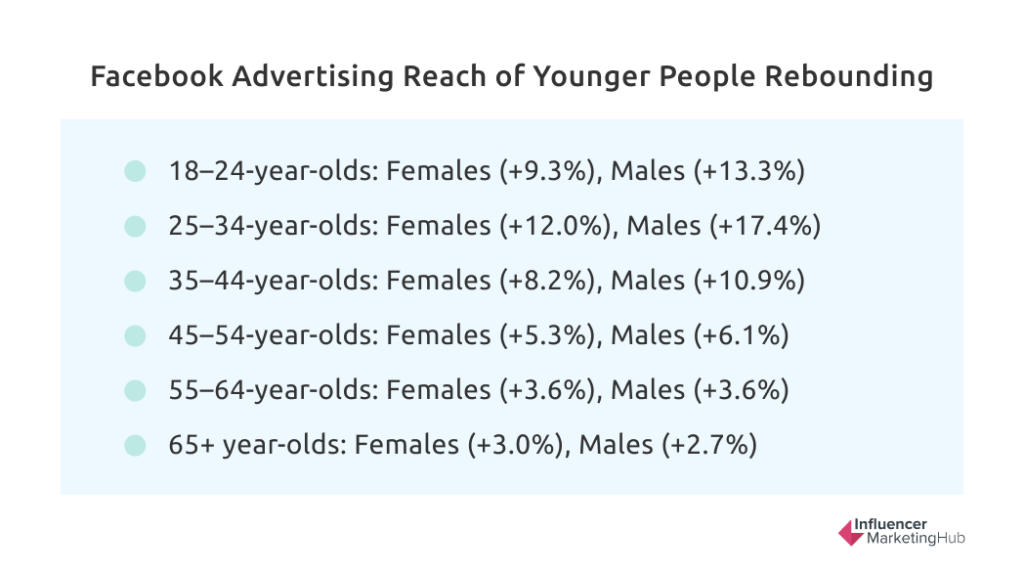
Facebook Advertising Reach of Younger People Rebounding
In last year’s benchmark report, we reported that the older generations were the fastest-growing groups for Facebook. This has changed in 2023, with the younger generations returning to the platform. In October 2023, Facebook reported the year-on-year annual change in Facebook advertising reach, split by age groups and gender:

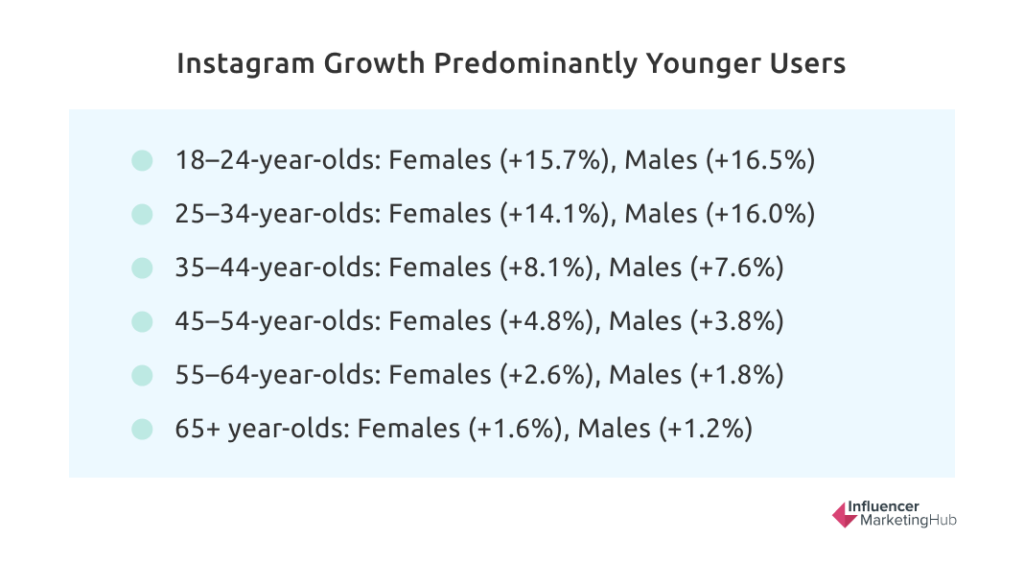
Instagram Growth Predominantly Younger Users
Although Instagram enjoyed sizable growth over 2020 at all age levels things have changed in 2023. Although Instagram still attracts a few older users, growth has dropped considerably over the last few years. And even the growth rate in younger Instagrammers is less than half what it was in our last report.

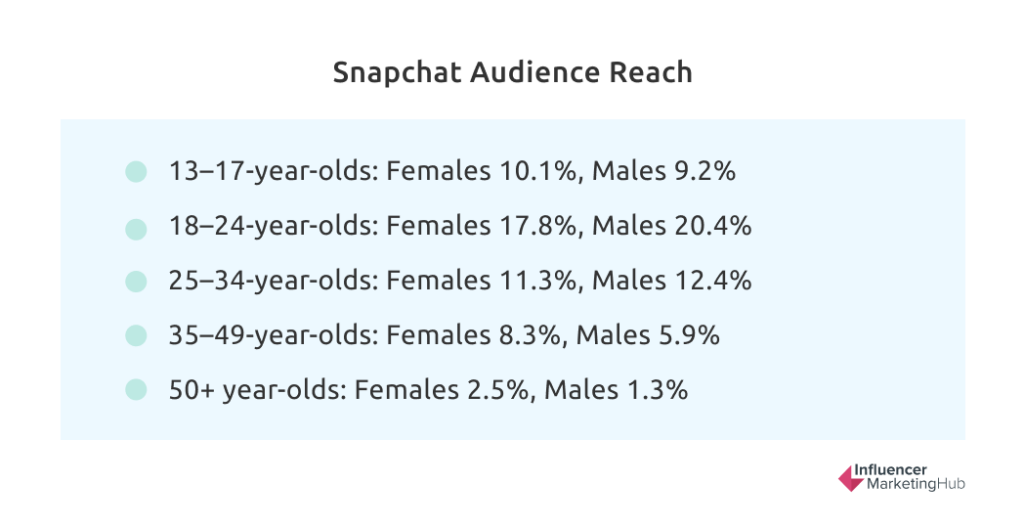
Snapchat’s Audience Reach is Young, But Not Perhaps as Young as You Would Expect
Snapchat has consistently been viewed as a social platform for the young. However, it appears that Snapchat’s users have stayed with the platform as they have aged, stretching Snapchat’s demographic profile.
Its advertising audience was made up as follows in October 2023:

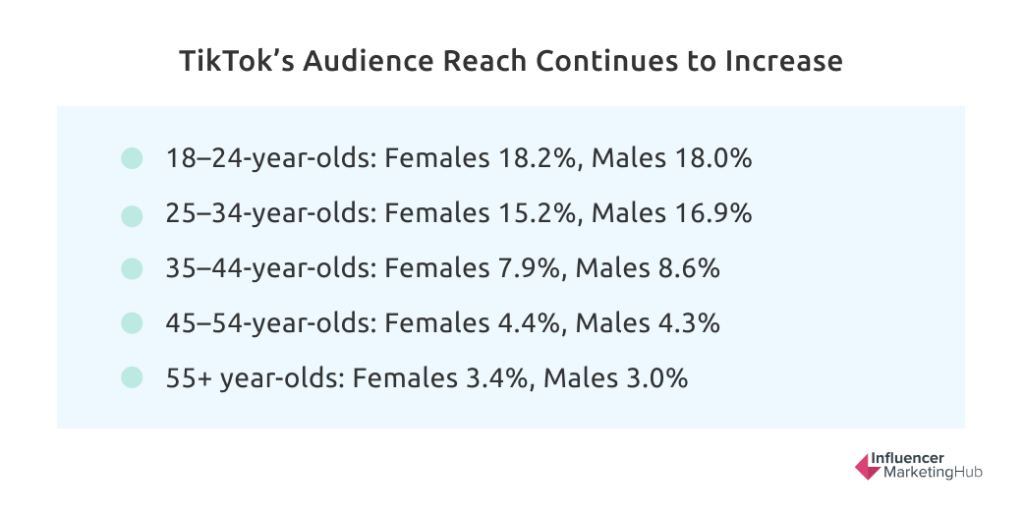
TikTok’s Audience Reach Continues to Increase, Particularly Among the Young
TikTok has also been viewed as a social platform for the young, and that does seem to be the case. While we don’t have statistics for those aged under 18, it is still very popular with those aged 18-34.
Its advertising audience was made up as follows in October 2023:

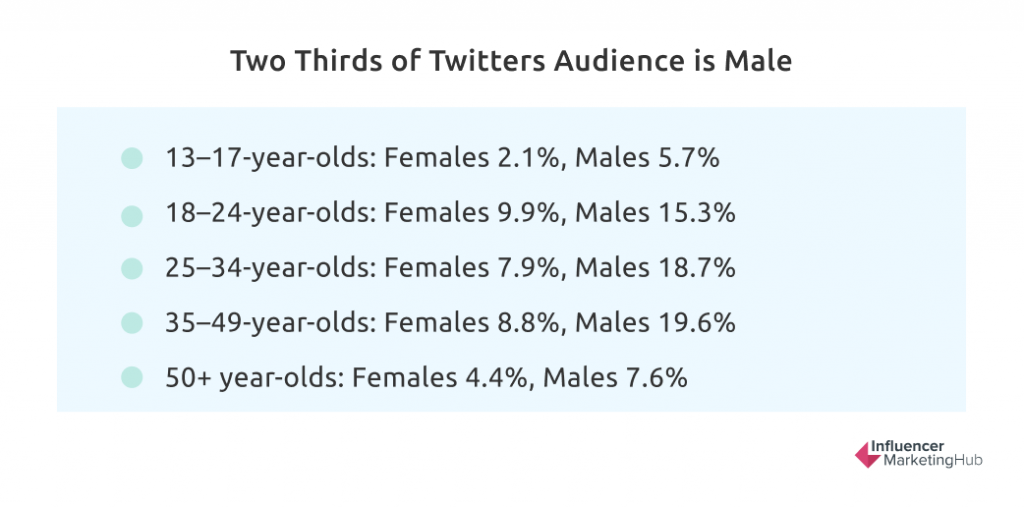
X (Twitter) Has a Largely Male Audience
Nearly two-thirds of Twitter’s potential advertising audience of 666.2 million are male, and this trend is evident at all age levels. X hasn’t released as much data recently, so we haven’t been able to update the composition of Its advertising audience recently, although it was made up as follows in January 2021:

Facebook and Instagram Have Their Largest Advertising Reach in India
Facebook and Instagram are currently banned in China, North Korea, and Iran. This makes India the market with the highest reach for Facebook (385.65 million) and Instagram (358.55 million.). Instagram’s reach in that region is considerably higher than in previous versions of this report. Other countries with exceptionally high Facebook reach include the USA (188.6 million), Indonesia (136.35 million), and Brazil (111.75 million). The same three countries also feature prominently in Instagram’s reach – the USA (158.45 million), Brazil (122.9 million), and Indonesia (104.8 million). These figures do not yet match the entire population of each country, however.
YouTube Also Has its Highest Reach in India, Particularly Amongst Younger People
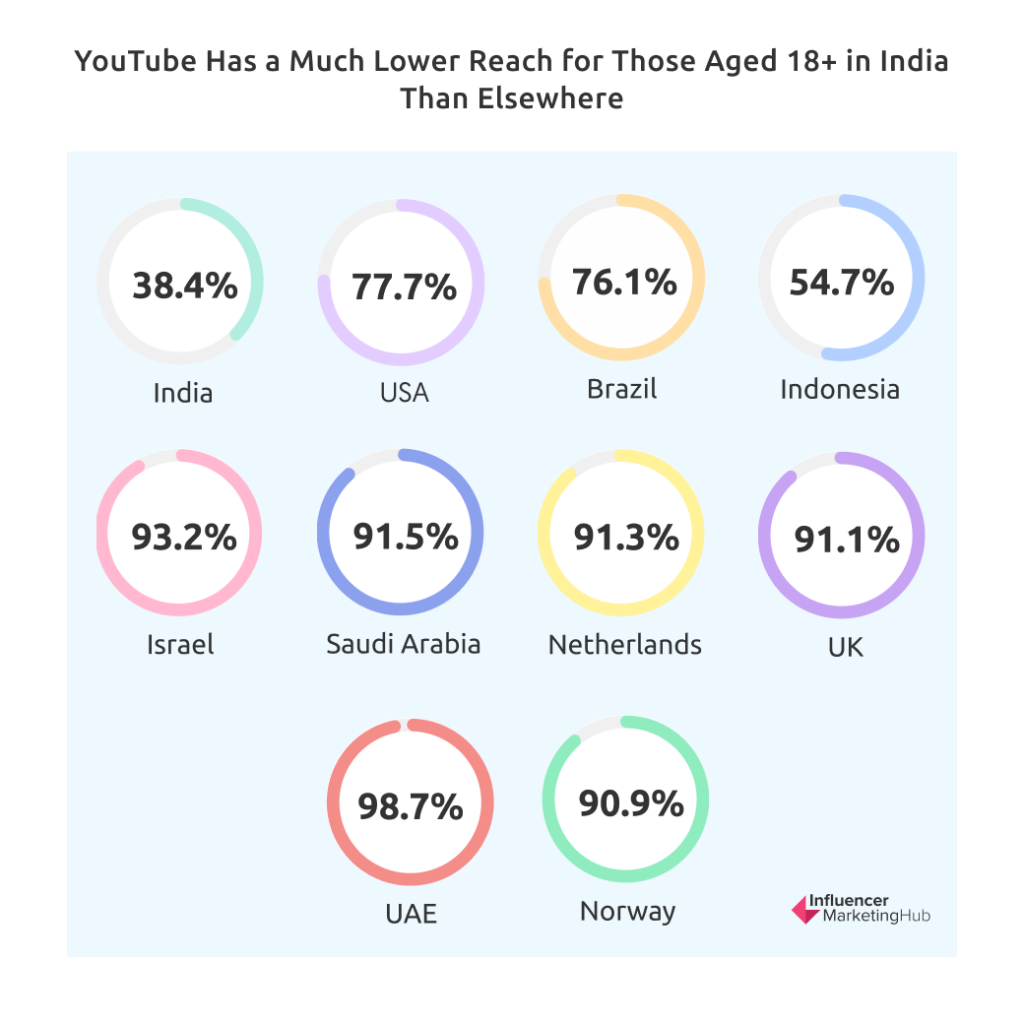
YouTube has an advertising reach of 462 billion people in India. However, it has a much lower reach for those aged 18+ (38.4%) in India than elsewhere. By contrast, although its overall reach in the USA is half that number, 239 million, YouTube reaches 77.7% of those aged 18+. Other countries with high reach are Brazil (144 million, 76.1% reach of those 18+) and Indonesia (139 million, 54.7% 18+).
In the UAE, YouTube can reach 98.7% of the population aged 18+, followed by Israel (93.2%), Saudi Arabia (91.5%), the Netherlands (91.3%), the U.K. (91.1%), and Norway (90.9).

TikTok’s Highest Reach is in the USA
With TikTok being banned in India (and operating as a separate app, Douyin, in its home nation of China, its highest advertising reach is now 143.41 million in the USA. This is closely followed by Indonesia (106.52 million) and Brazil (94.96 million).
While we don’t have reach numbers for Douyin, it does have 743.0 million active users.
LinkedIn Has its Highest Reach in the USA.
Unlike the Facebook brands, LinkedIn still has its highest potential advertising audiences in the United States, with a reach of 220 million. However, India is in second place with a reach of 110 million, followed by Brazil (65 million) and China (59 million). However, LinkedIn left the Chinese market in May 2023, with most of its Chinese users moving to a local Chinese competitor, Maimai. Maimai currently enjoys 110 million users on its platform, nearly all of whom are male.
Snapchat Has its Highest Reach in India.
Snapchat has its highest potential advertising audience in India, with a reach of 192.6 million. The USA is in second place with a reach of 108.5 million, followed by Pakistan (28.7 million) and France (27.5 million).
X (Twitter) Has its Highest Reach in the USA and a Surprisingly High Reach in Japan
X (Twitter) has its highest potential advertising audience in the United States, with a reach of 108.55 million. Japan takes second place with a reach of 74.1 million, followed by India (30.3 million) and Indonesia (27.05 million). Considering X’s high profile, it has a surprisingly lower reach than many less established social networks.
Pinterest Has by Far its Highest Reach in the USA.
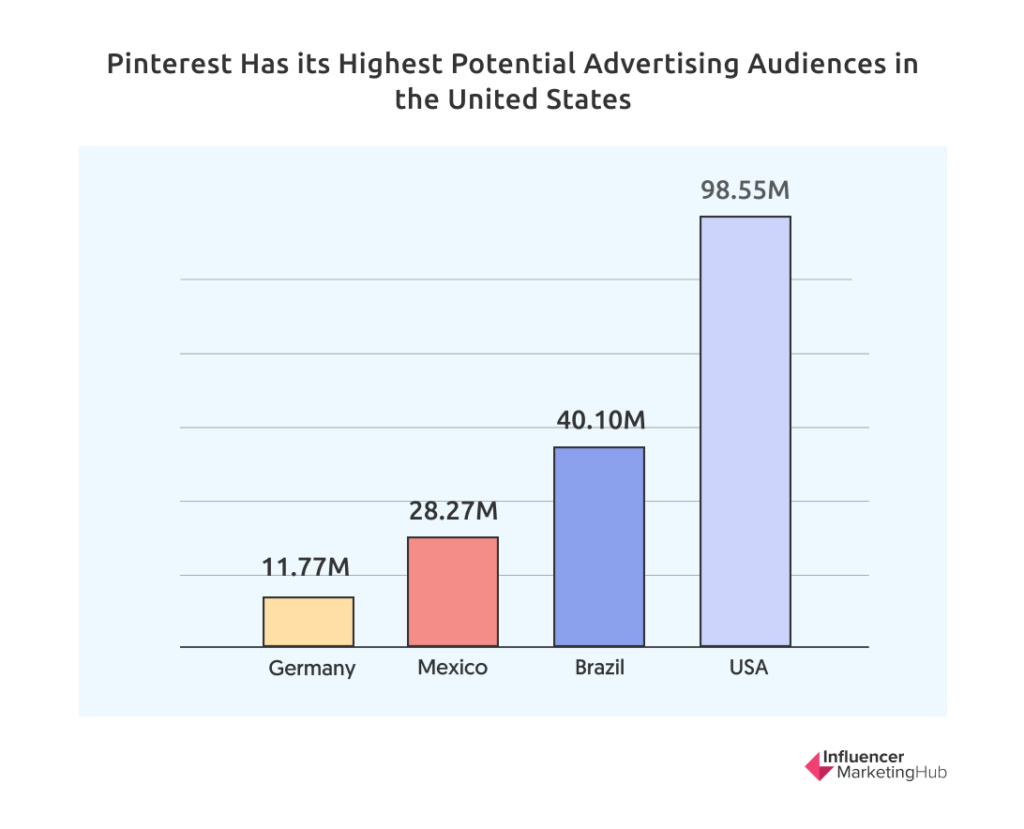
Pinterest has its highest potential advertising audience in the United States, with a reach of 98.55 million. A long way behind is Brazil in second place with a reach of 40.1 million, followed by Mexico (28.265 million) and Germany (11.765 million).

Facebook’s Eligible Audience Reach in UAE and the Philippines is Greater Than Their Entire Population
One of the stranger statistics from Facebook data is that the number of users advertisers can reach on Facebook (ages 18+) in UAE is 113.7% and in the Philippines 112.6% of that nation’s population. This clearly recognizes that some businesses have Facebook accounts, and some people have multiple.
The percentages are not as high elsewhere, although the advertising reach of several other countries exceeds 90% of the 18+ population. These include Vietnam (99.9%), Mexico (98.9%), and Colombia (94.1%).
Facebook’s advertising reach in the USA is a more moderate 70.8%.
Globally, the average is only 39.0%, with a few highly populated countries having small reach percentages: Japan (15.0%), South Korea (19.1%), Nigeria (30.2%), and India (36.4%).
Despite Facebook being illegal in China, it still has an adult reach rate of 0.1% there.
TikTok Officially Reaches More Than 100% of the Adult Population in 7 Nations
Surprisingly, TikTok reports reaching more than 100% of the population 18+ in Saudi Arabia (135.0%), UAE (127.9%), Kuwait (122.8%), Iraq (119.2%), Qatar (113.9%), Malaysia (106.9%), and Lebanon (103.7%). Kepios Analysis attributes this to user age misstatements, duplicates, and fake accounts.
Instagram’s Global Audience Reach is 20%
Instagram has yet to have the following of its older sibling but still has a global advertising audience reach (for adults 18+) of 27.2%. As with Facebook, Instagram’s audience share varies markedly between nations. Its reach is highest in Turkey (85.9%), UAE (84.5%), Chile (78.5%), Argentina (77.5%), and Brazil (75.0%). It has considerably less reach in Africa, including Kenya (8.5%), Nigeria (10.3%), and Ghana (10.8%).
Like its older sibling, Instagram has a small (illegal) following of 0.4% in China.
YouTube’s Largest Advertising Audience Sector is Males 25-34
Based on October 2023 data, YouTube’s advertising audience is split up as follows:
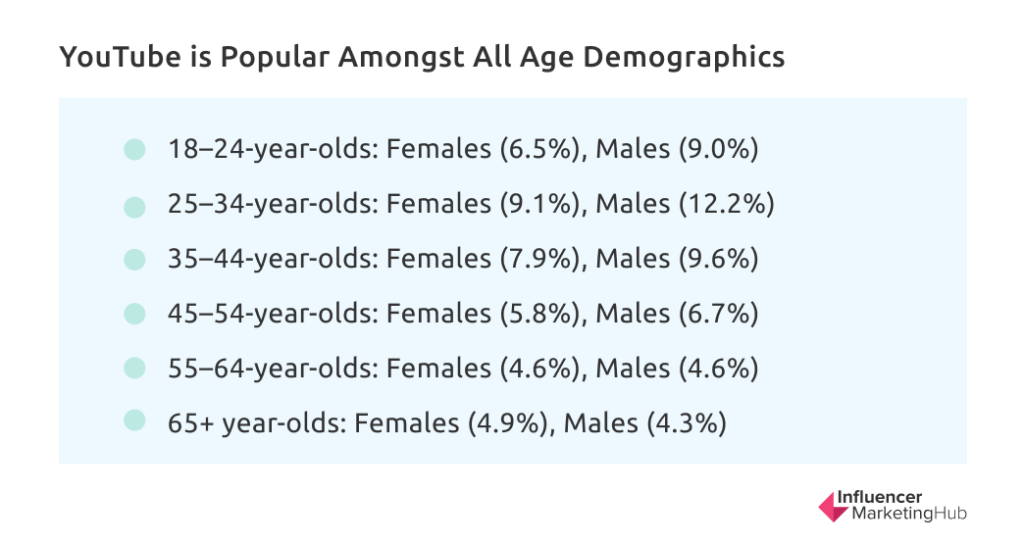

This makes it relatively popular across the ages, particularly with people under 55, and more used by males than females, particularly in the younger age bands.
Engagement Rates on Social Media Platforms
RivalIQ defines engagement as measurable interaction on organic and boosted social media posts, including likes, comments, favorites, retweets, shares, and reactions. The Engagement Rate is calculated based on all these interactions divided by the total follower count.
The Median Facebook Engagement Rate / Post is 0.06%
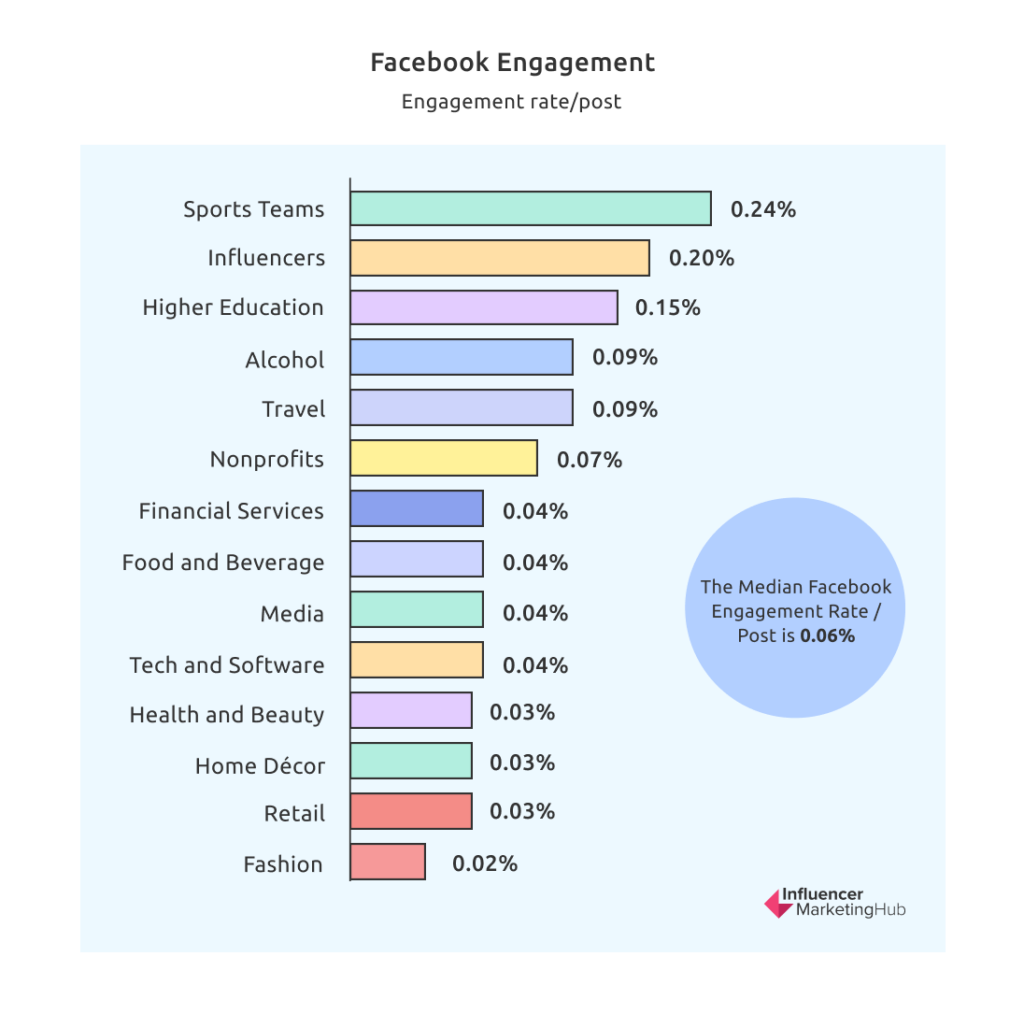
Rival IQ. discovered that the median engagement rate/post for businesses with Facebook pages over 2022 was 0.06%. Facebook engagement declined a little compared to the previous year. Tech and Software brands managed a slight increase, and Retail and Travel stayed flat.
There is quite some variation in the engagement/rate per post when you analyze by industry, however:

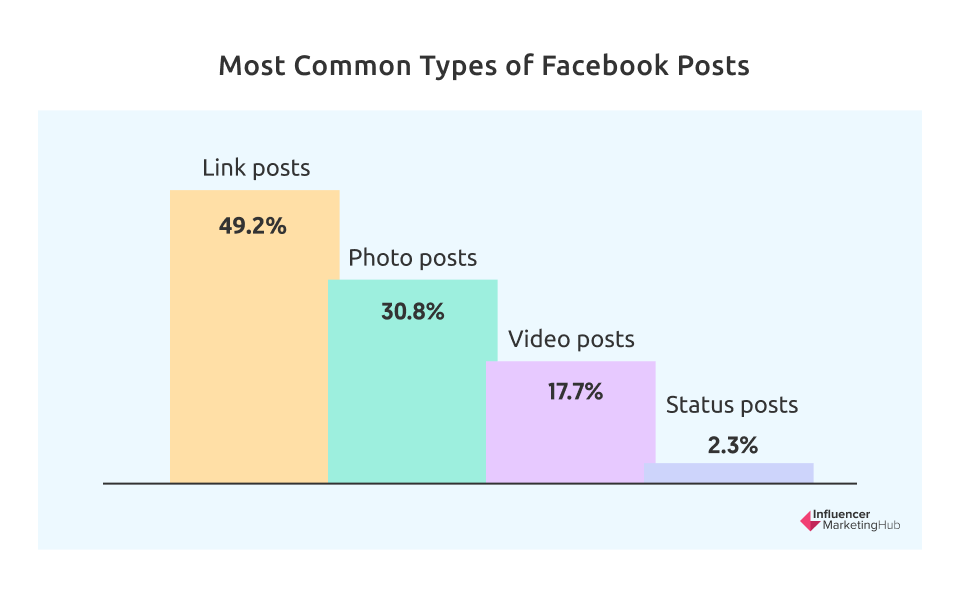
The Most Common Types of Posts Made on Facebook Pages are Link Posts
Locowise provides figures for Q3 2023 showing the comparative share of each type of Facebook Page post. Almost half of all posts made were link posts. The most common types of Facebook posts are:

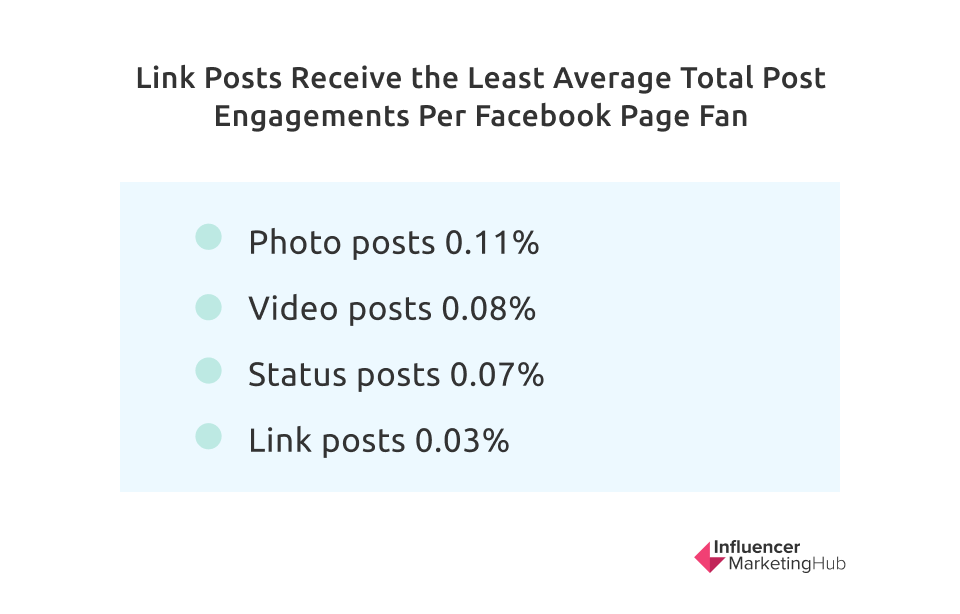
Link Posts Receive the Least Average Total Post Engagements Per Facebook Page Fan
Interestingly the number of Facebook page post engagements compared to the total number of page fans are almost inverse to the most common types of posts made on Facebook pages. The average total post engagements vs. page fans for all post types is 0.06% (down from 0.11% in 2021).

The average total post engagement vs. page fans for all post types varies considerably by nation.
Engagement Rates are Higher for Smaller Facebook Pages
According to Locowise data, the average Facebook page post engagement rate for pages with fewer than 10,000 fans is 0.43%. This drops to 0.21% for pages with 10,000 – 100,000 fans and 0.04% for pages with more than 100,000 fans. Clearly, the largest pages have many lurkers who don’t take an active part in page activity.
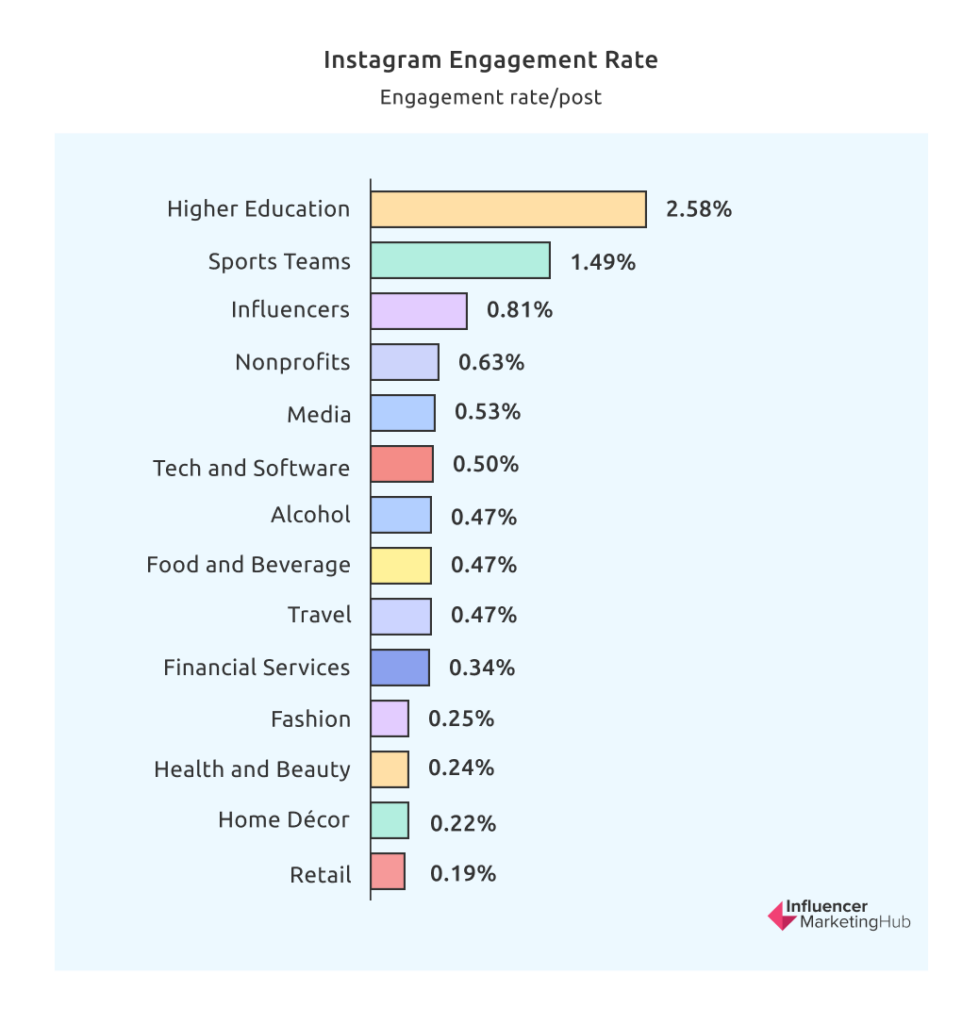
The Median Instagram Engagement Rate / Post is 0.47%
Rival IQ. discovered that the median engagement rate/post for firms with Instagram Business Profiles over 2022 was 0.47%, less than half what it was in 2020. Instagram engagement rates fell 30% over the year.
There were some positive trends in the Instagram engagement/rate per post when you analyze by industry, however:

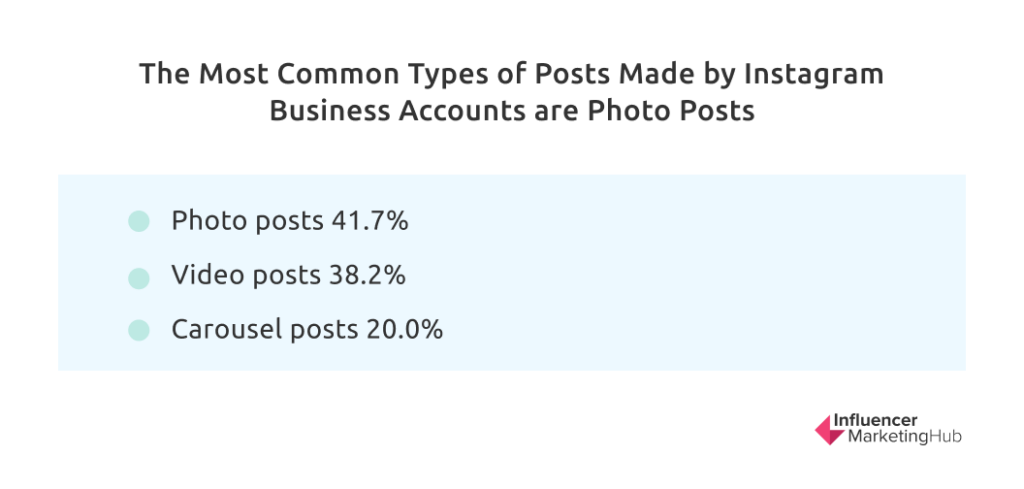
The Most Common Types of Posts Made by Instagram Business Accounts are Photo Posts
Locowise also provided figures showing the comparative share of each type of Instagram Business Account post in Q3 2023. Although two in five business posts are photo posts this is down considerably from 2020’s 63.6%. Almost all that change has gone to video posts, which have more than doubled in usage. The most common types of Instagram Business Account posts are now:

Carousel Posts Have the Highest Engagement Rates on Instagram
According to Locowise figures, carousel posts have an average engagement rate of 0.73% for Instagram business accounts. This falls to 0.63% for video posts and 0.54% for photo posts. The average engagement rate for all post types is 0.61%. The higher levels of engagement for video compared to photo posts may be one of the main reasons for the increase in popularity of video posts in recent times, although surprisingly there has been little growth in carousel posts.
Engagement Rates are Higher for Smaller Instagram Business Accounts
According to Socialinsider data, the average Instagram post engagement rate for business accounts with fewer than 10,000 followers is 1.22%. This drops to 0.98% for business accounts with 10,000 – 100,000 fans and 0.81% for accounts with more than 100,000 followers.
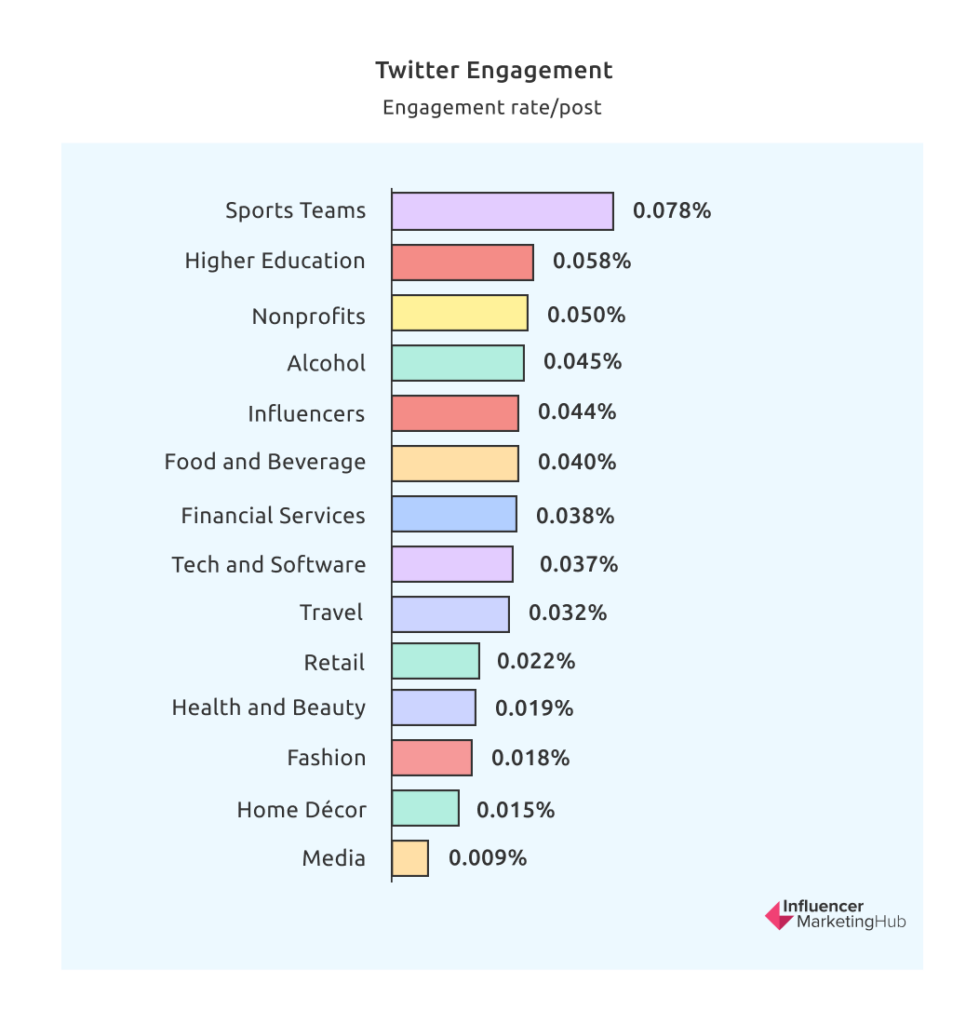
The Median X (Twitter) Engagement Rate / Post is 0.035%
Rival IQ. discovered that the median engagement rate/post for firms with Twitter (as it was then called) profiles over 2022 was 0.035%. This was almost identical to the previous year’s engagement, although down on 2020’s 0.045%.
There were some positive trends in the Twitter engagement/rate per post when you analyze by industry, with some managing to increase their engagement rates.

The Median TikTok Engagement Rate / Post is 5.69%
Rival IQ. discovered that the median engagement rate/post for firms with TikTok profiles over 2022 was 5.69%. This is the first year Rival IQ has analyzed this statistic.
When you analyze by industry, Higher Education, Sports Teams, Travel, and (surprisingly) Financial Service posts engendered the most engagement.
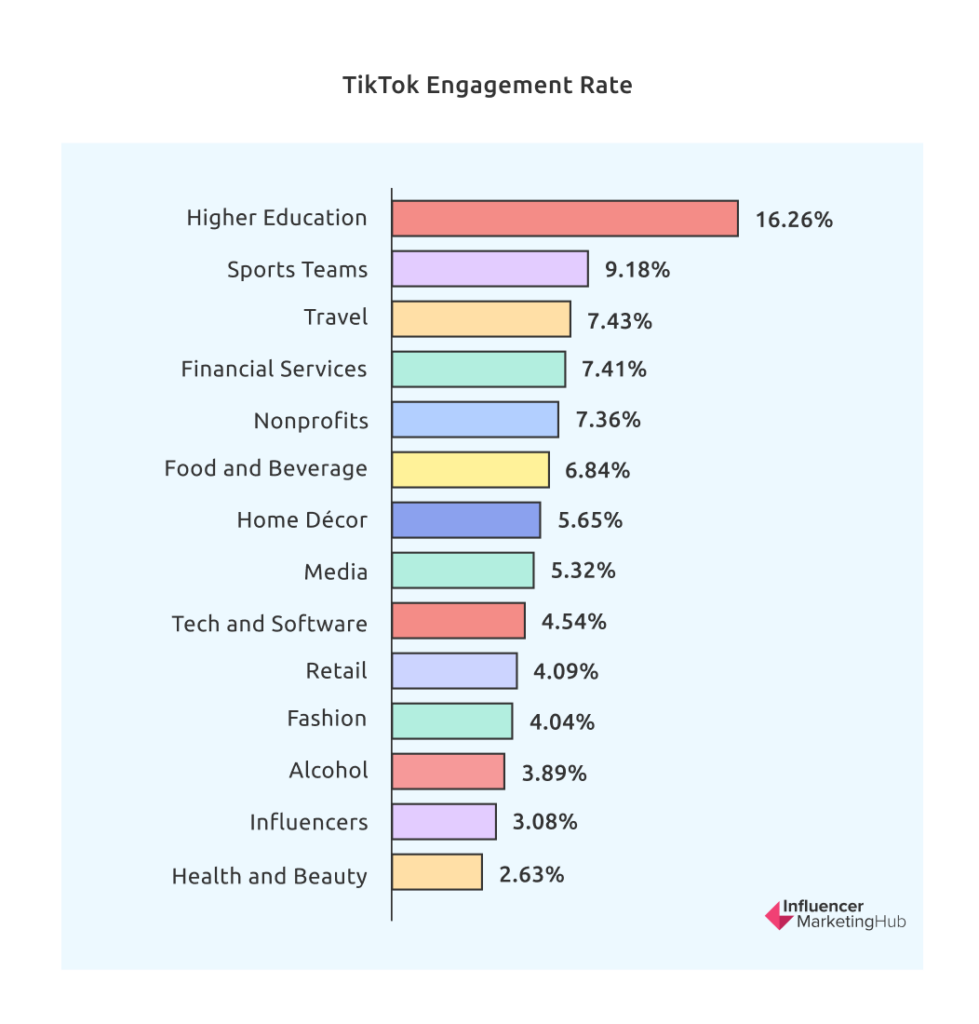

The low engagement ranking for influencers is particularly surprising, and it will be interesting to see if Rival IQ notices a similar trend in future years.
Posting Frequency on Social Media Platforms
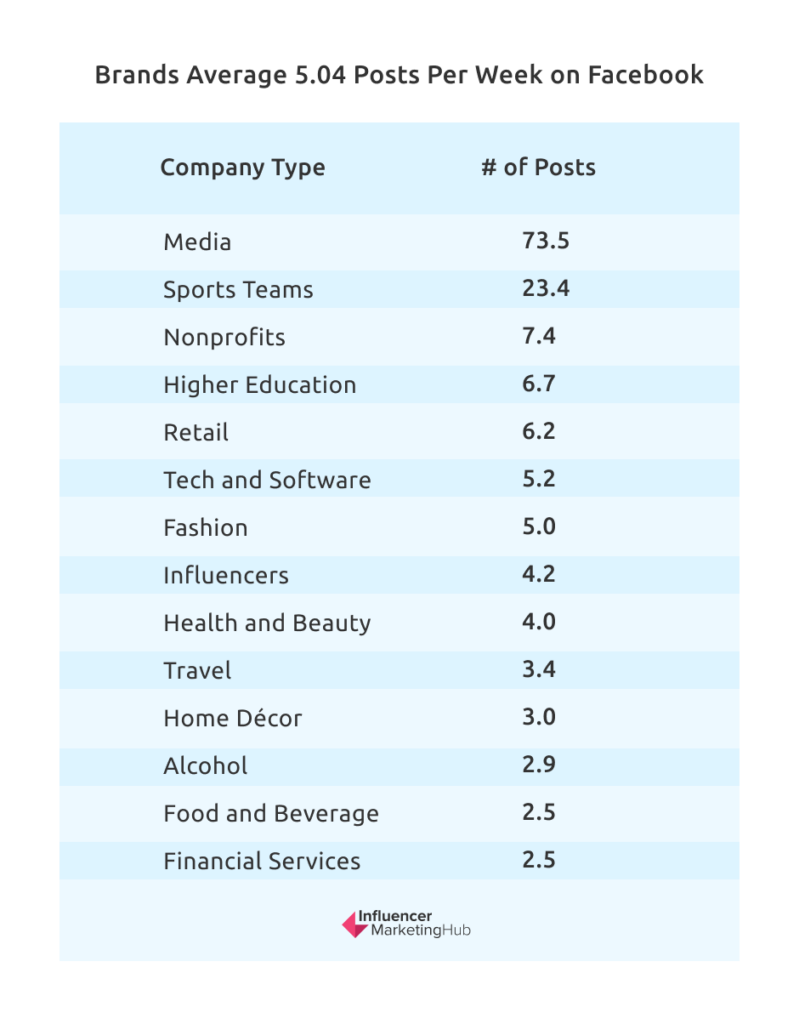
Brands Average 5.04 Posts Per Week on Facebook
The median number of posts that brands make each week on Facebook is 5.04, slightly down from last year. Unsurprisingly, media companies average many more posts than other types, with sports teams also standing out:

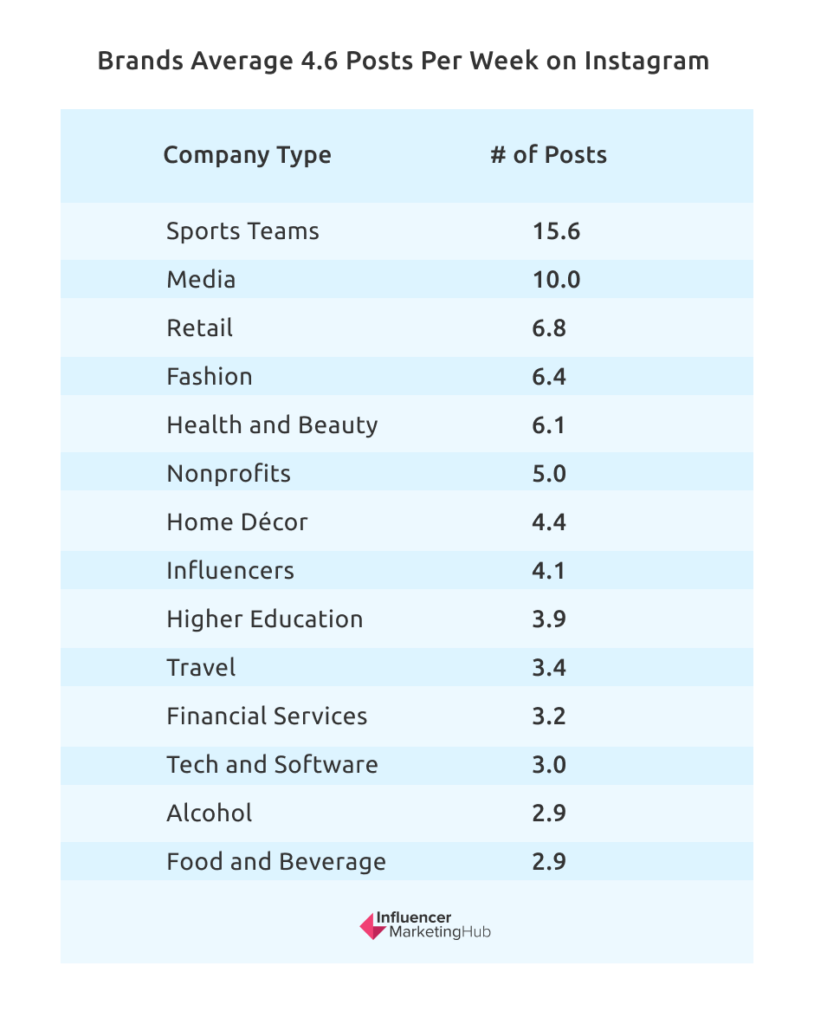
Brands Average 4.6 Posts Per Week on Instagram
The median number of posts that brands make each week on Instagram is 4.6, slightly up from last year. Sports teams average many more posts than other types, with media companies not posting to Instagram anywhere as much as Facebook.

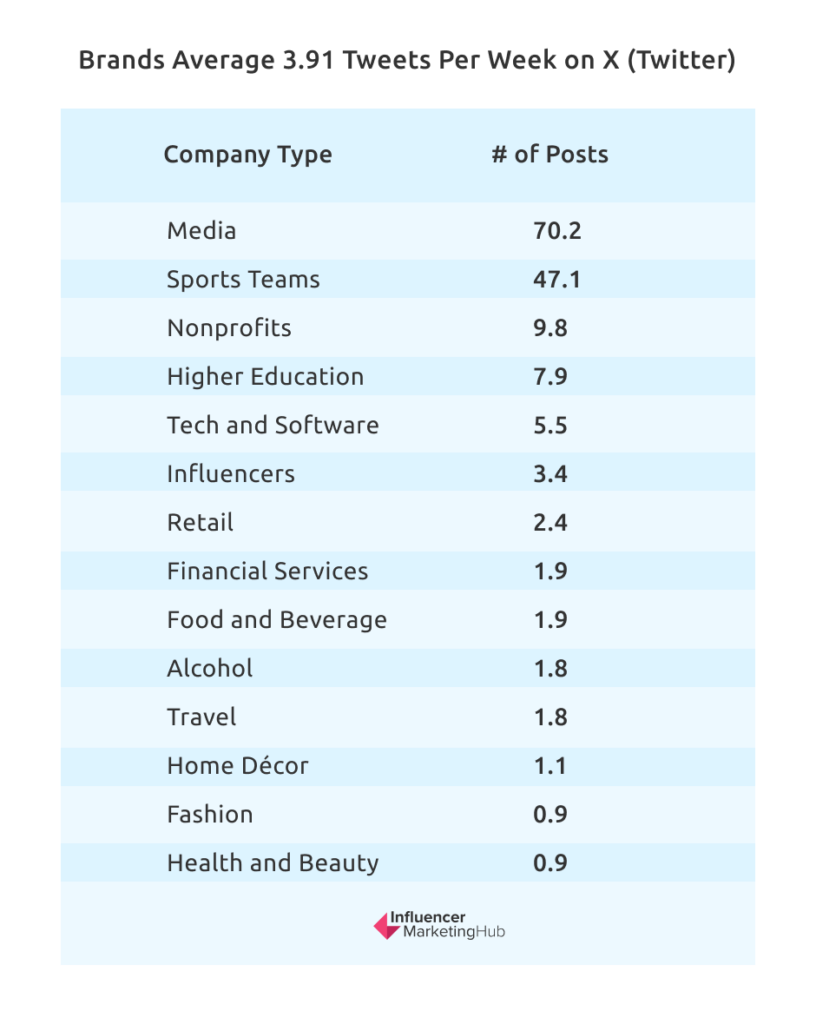
Brands Average 3.91 Tweets Per Week on X (Twitter)
The median number of tweets that brands made each week on Twitter in 2022 was 3.91, down by about 20% from the previous year. Note that this predates Elon Musk’s changes to the platform and rebrand to X. Officially, “tweets” are now called “posts”. Media companies and sports teams average considerably more tweets than other types.

Brands Average 1.75 Videos Per Week on TikTok
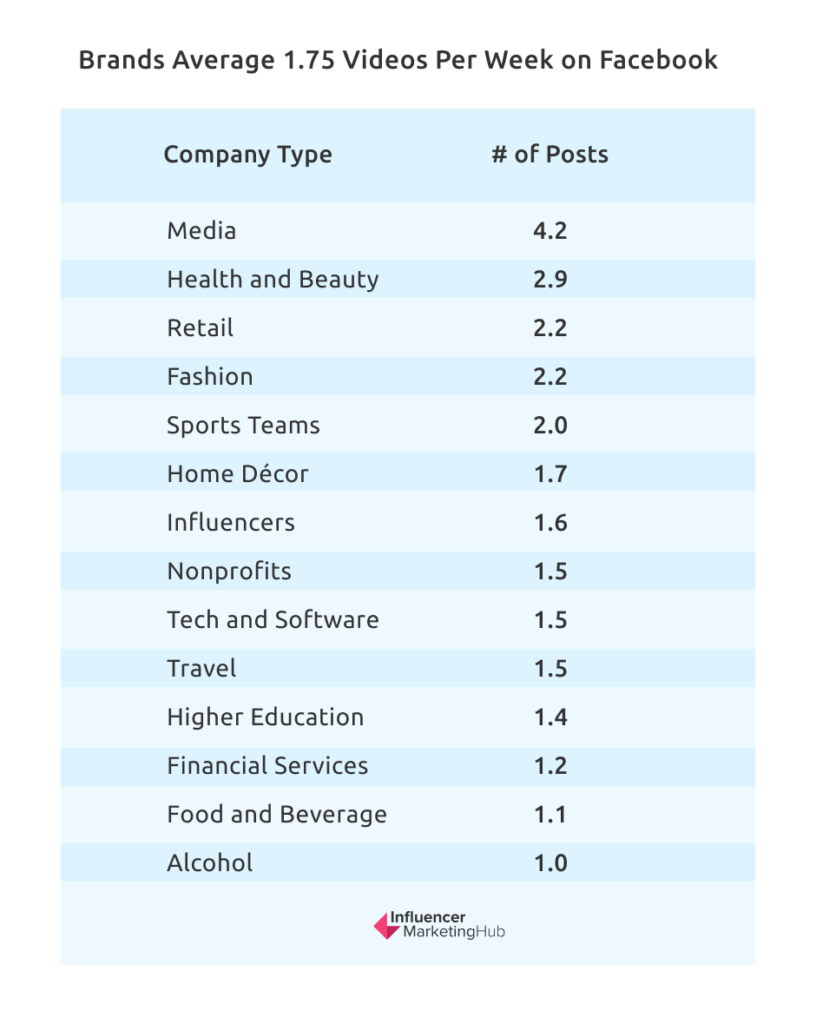
The median number of videos that brands make each week on TikTok is 1.75. This is the first year that Rival IQ has collected these figures. As with Facebook, media companies average many more posts than other types, with health & beauty also standing out:

Number of Active Users Across All Social Media Platforms
4.95 Billion Social Users Globally
As of June 2023, there were 4.95 billion active social media identities globally. That means 61.4% of the world’s 8.06 billion population now uses social media.
Numbers vary across countries, however. For example, 94% of the residents of Saudi Arabia are active social users, followed by 93.1% of South Koreans. Social media is so popular in the UAE that they have more accounts than users (105.6%).
However, usage in Africa is well down, with only 16.1% using social media in Nigeria, 22.5% in Ghana, and 23.8% in Kenya.
Presumably, there are very few social media users, if any, in North Korea.
80+% of the Population in Northern and Western Europe Use Social Media
Perhaps unsurprisingly, social media use is highest in the more developed parts of the world. The parts of the world with the highest social media penetration are Northern Europe (81.8%), Western Europe (80.4%), Southern Europe (74.7%), Eastern Asia (73.3%), North America (71.4%), and Eastern Europe (70.2%). Conversely, regions with minuscule social media usage are Middle Africa (10.1%), Eastern Africa (10.3%), Western Africa (16.0%), Central Asia (32.6%), Southern Asia (32.8%), and Southern Africa (44%).
7% Growth in Social Media Users in a Year
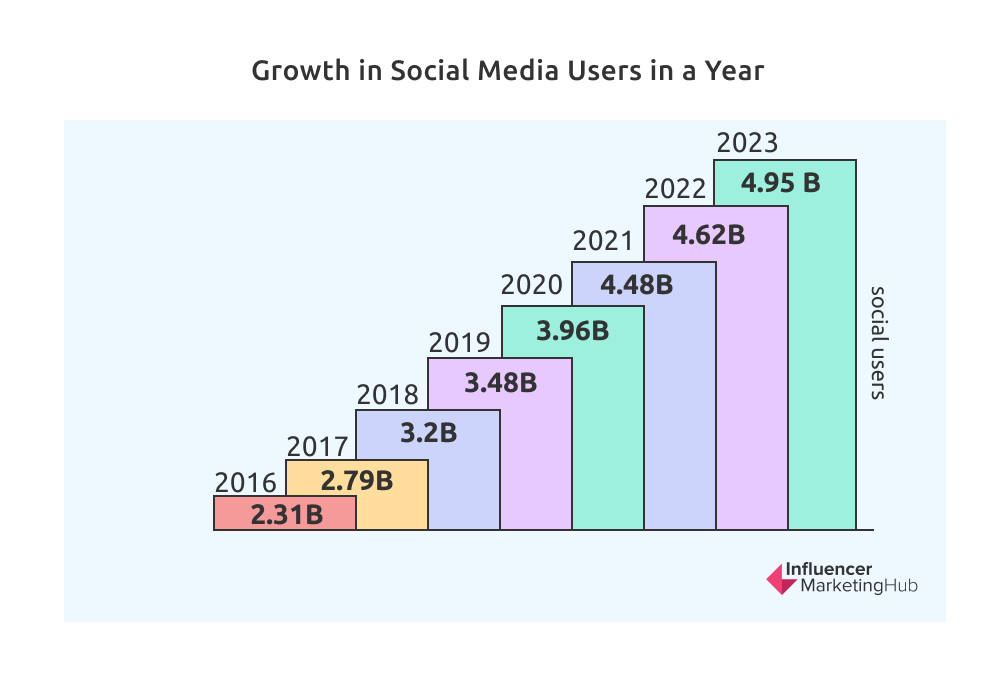
Social use increased rapidly during the early years of Covid. Since then, the growth rate of new social users has fallen but remained positive each year.
In the twelve months to June 2023, there was a 327 million (7.07%) increase in active social media identities across all platforms globally.
This continues a constant trend over the last few years. Back in 2016, there were 2.31 billion social users. Numbers rose 20.9% during 2017 to reach 2.79 billion. Social users rose 9.0% the following year to 3.2 billion, followed by a 9.2% increase in 2019 to 3.48 billion, a 13.7% increase in 2020 to 3.96 billion, a 13.1% increase in 2021 to 4.48 billion, a 3.2% increase in 2022 to 4.62 billion, and the 7.07% increase in 2023 leading to 4.95 billion social users.

Nearly 40% of People Use Social Media for Work
37.6% of internet users aged 16 to 64 claim to use social media for work purposes. This includes using social media to network for work, plus those who follow work contacts, entrepreneurs, or businesspeople.
Unlike most social media activities, a higher percentage of males use social media for work at all age levels. This is particularly notable in older age groups, with 32.5% of 55-64-year-old males utilizing the Internet for work, compared to 25.9% of females.
Usage of social media for work varies between countries, ranging from a high of 51.9% of South Africans (although that is 10% lower than in our last report), to a low of 9.1% of Japanese social media users. Obviously, nations with little social media usage, like North Korea, are not included in these statistics.
The UK (26.8%), Germany (21.0%), and the USA (28.7%) have comparatively low social media usage for work.
Average of 6.7 Social Accounts
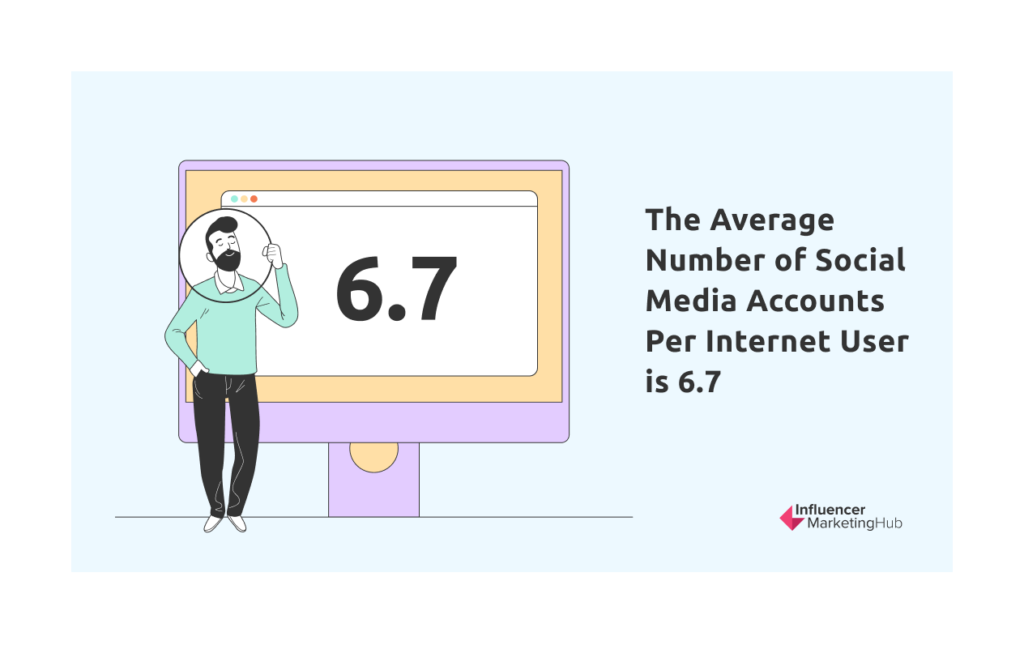
If you’re somebody who just runs a Facebook account or perhaps watches YouTube, you might be surprised at how many accounts most people have. The average number of social media accounts per internet user is 6.7 (down from 2020’s 8.4).
This varies considerably from country to country. For example, Japanese people only average 3.5 social accounts. On the other hand, USA social users mirror the average, having 7.1 social accounts on average. However, Brazilian social users clearly like to spread their time across a range of social networks, with their internet users having an average of 8.1 social media platforms.
These numbers represent all the social platforms where users have an account and do not necessarily mean that they use every account regularly.

Social Media Platforms: User Overlaps
Nearly Everyone Operates Multiple Social Accounts
We saw above that most people operate multiple social media accounts. The popular social platform with the highest percentage of unique users is YouTube, but even they only have 1.1% of users who stick solely to that platform. WhatsApp has 0.7% of its users unique to its platform. Facebook can only exclusively claim 0.4% of its users.
Niche communications platform, Line, can claim to be more exclusive than any of the better-known platforms, however. 3% of their users say that they solely use that platform – but even then, 97% mix Line with something else.
All other social platforms have 0.2% or fewer exclusive users. For example, only 0.1% of TikTok users admit to only using that platform. This means there is considerable overlap in the use of the various social networks.
Surprisingly the strongest correlation comes between Discord and YouTube. 87.1% of Discord members also use YouTube. This is perhaps not that surprising when you consider that many YouTube channels use matching Discord channels for conversation.
Strong Correlation Between Facebook and Instagram
It is probably unsurprising to see that many people operate both Facebook and Instagram accounts. This is partly because Facebook owns Instagram, and their advertising networks intertwine.
The correlation is particularly evident for Instagram users, 81.4% of whom also operate a Facebook account. While the reverse connection is less intense (78.5% of Facebook users use Instagram), it is still clear-cut.
Many Facebook and YouTube Users Spend Time on Both Platforms
A widespread combination of social accounts is Facebook and YouTube. Indeed, 76.0% of Facebook users also use YouTube. Of course, the two platforms have different purposes, so it is perhaps not surprising that many people use both.
Things are fairly similar in the other direction, too. For example, 76.2% of YouTube viewers also use Facebook. Thus, there is a strong correlation between the two networks, despite Facebook’s increased encouragement of people sharing video clips in recent years.
Most Other Social Users Also Use Facebook, Instagram, and YouTube
It isn’t just Facebook fans, Instagrammers, and YouTubers who visit each other’s preferred platforms. Indeed, users of most social networks spend time looking at Facebook posts and Instagram images and watching YouTube videos, as well as at least one other social app. This applies to all the surveyed networks (except for Line which is something of an outlier), all of whom have at least 76% overlap with Facebook, 75%+ overlap with Instagram, and 76%+ overlap with YouTube.
Most TikTok Users Have a Facebook Account, But Far Fewer Facebook users Use TikTok
Facebook and TikTok have a much weaker overlap. This is probably unsurprising – although people of all ages run Facebook accounts, you only tend to find Generation Z and Millennials members using TikTok (although that is rapidly changing). As a result, while 81.9% of TikTok users also operate Facebook, only 51.1% of Facebook users operate TikTok accounts.
Discord users are the social platform most likely to also have a TikTok account (61%).
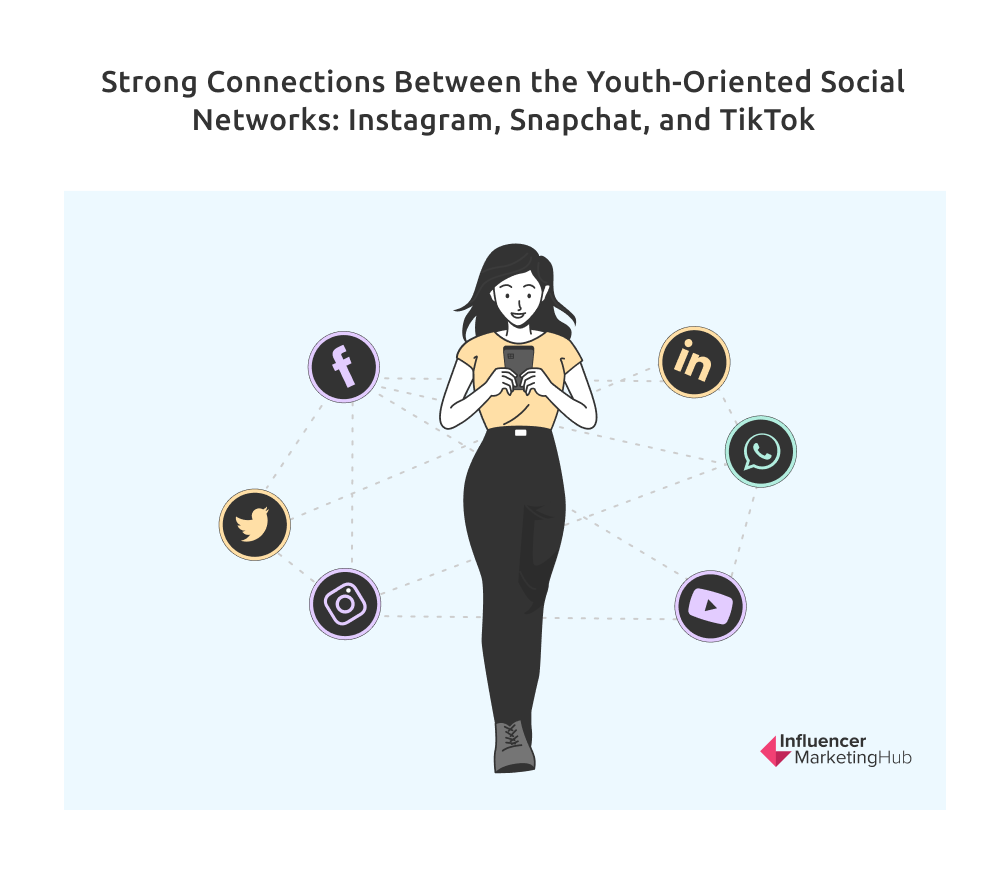
Strong Connections Between the Youth-Oriented Social Networks: Instagram, Snapchat, and TikTok
Many of the younger generations operate a combination of Instagram, Snapchat, and TikTok accounts. For example, 89% of Snapchatters run Instagram accounts, and 57.9% run TikTok accounts. Conversely, 80.4% of TikTok fans run an Instagram account and 36.8% run Snapchat. Numbers are less clear-cut for Instagram users (because they have a broader support base), but 36.6% also have Snapchat accounts, and 52.0% also use TikTok.

Reasons for Using Social Media
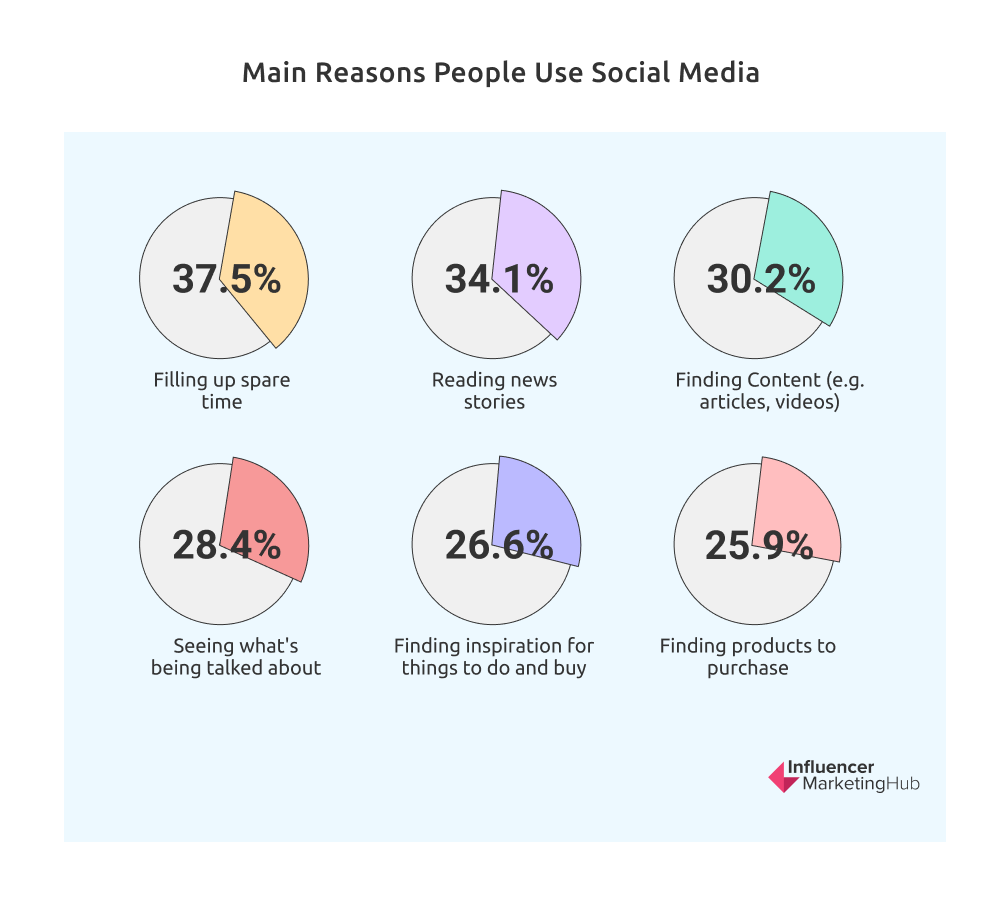
The Main Reason People Use Social Media is to Stay in Touch with Friends and Family
Global Web Index asked internet users why they used social media. The most common purpose by far in Q2 2023 was to stay in touch with friends and family (48.7%). Other popular reasons for people using social media were:

Nearly 1 in 5 People Go on Social Media to Follow Celebrities
The fifteenth most popular reason for using social media (with 19.6% support) is to follow celebrities or influencers. This is a sizable group, which could open possibilities for brands considering working with celebrity influencer marketing.
1 in 5 People Claim to Follow Influencers
Worldwide, 20.9% of people admit to following influencers or other experts on social media. This percentage varies considerably between countries, however. For example, the greatest supporters of influencers are people from the Philippines (45.6%) and Brazil (41.7%), before dropping down to multiple countries headed by Indonesia (32.7%) and South Africa (32.4%).
The countries that claim the least interest in following influencers are Russia (6.2%), Turkey (12.0%), China (13.5%), and Czechia (13.6%).
More Females Than Males Follow Influencers
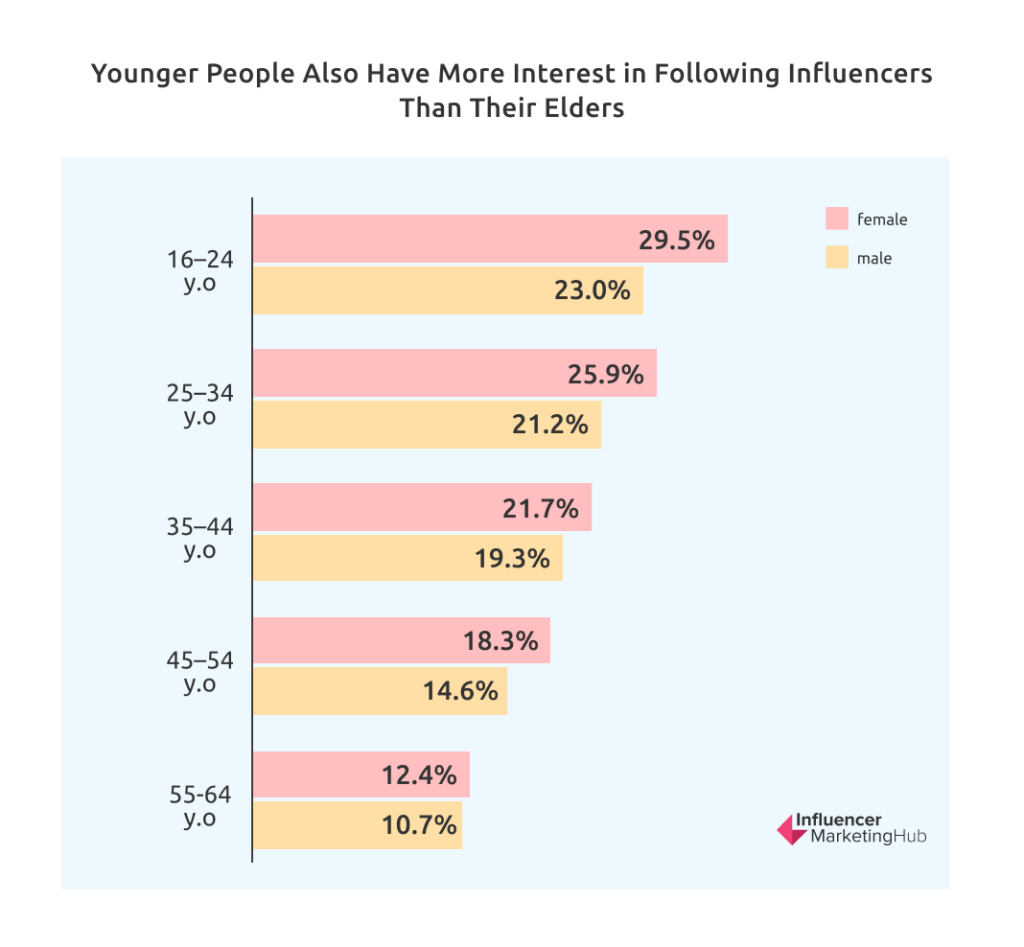
When you analyze influencer following figures by age and gender, you see a clear imbalance between females and males in most age groupings. Younger people also have more interest in following influencers than their elders.
29.5% of females aged 16-24 say they follow social media influencers, compared to 23.0% of their male counterparts. For 25–34-year-olds, the figures are females (25.9%), and males (21.2%). This trend continues for 35–44-year-olds – females (21.7%), males (19.3%), 45-54 year-olds – females (18.3%), males (14.6%), and 55-64 year-olds – females (12.4%), males (10.7%).

30% Say Social Media is the Main Way They Access News Content Online
The Reuters Institute Digital News report 2023 reports that 30% of people now consider social media as the main way they access news content, up from 23% in 2018. Conversely, the percentage using news websites/apps has fallen from 32% to 22%.
The remaining ways that people find news online are Search (25%), Mobile Alerts (95), Aggregators (8%), and Email (5%).
There are clear cultural differences, however. News websites/apps are still popular in Finland (63%), Norway (59%), Denmark (50%), and Sweden (48%). Social media is most popular for news dissemination in Thailand (64%), the Philippines (53%), Chile (52%) and Peru (49%). Many Asian countries prefer deeply aggregated news coverage: South Korea (66%), Japan (65%), Taiwan (50%), and India (43%).
In the UK 41% of 18–24s say social media is now their main source of news), up from 18% in 2015.
Facebook Remains the Most Important Network for News, But Falling in Importance
Facebook remains the most important network at 28% but is now 14 points lower than its 2016 peak (42%). This is partly because Facebook has made a conscious effort to distance itself from news and had to make agreements to pay for news shared on its platform in some countries.
YouTube is gradually growing as a news source, with 20% using the platform for news in 2023. Although the percentage using TikTok for news is low (6%), this is a steep rise from 1% in 2020. Usage is much higher with younger groups and in some Asia-Pacific, Latin American, and African countries. For example, 20% of 18-24 year-olds use TikTok for news, as do 30% of people (of any age) in both Peru and Thailand.
Mainstream Journalists Lead Conversations Around News on X (Twitter) and Facebook, But Struggle to Gain Traction on the Newer Social Networks
While mainstream journalists often lead conversations around news on X (Twitter) and Facebook, they struggle to get attention on newer networks like Instagram, Snapchat, and TikTok. Here, personalities, influencers, and ordinary people are often more prominent, even in conversations around the news.
For example, 43% take notice of mainstream news posts on Facebook, with 38% hearing their news from personalities, and 29% ordinary people. On TikTok, however, 55% view news from personalities, 44% from ordinary people, and just 33% from mainstream media accounts.
The Impact of Social Media on Mental Health by Demographic
Nearly 1 in 5 Gen Zs Claim Social Media Gives Them Anxiety
Younger people feel the connection between social media and mental health most strongly. The pandemic has undoubtedly exacerbated this. 19% of Gen Z internet users (aged 16-23) say that social media gives them anxiety. In comparison, 16% of Millennials (24-37) feel the connection, along with 14% of Gen X (38-56) and 12% of Baby Boomers (57-64).
Favorite Social Media Platform
Globally, Most People Rate WhatsApp, Facebook, and Instagram as Their Favorite Social Media Platforms (Along with WeChat in China)
A broad survey of internet users aged 16 to 64 were asked about their favorite social platforms. Unlike previous versions of the survey, the most recent edition includes China. The inclusion of China in the survey means that you can’t compare these results with what we reported in previous years.
Three Facebook-owned platforms strongly dominate this alongside the Chinese communications app, WeChat. WhatsApp topped with 16.6% support, followed by Instagram (15.7%), WeChat (13.5%), and Instagram (13.0%).
GWI treated TikTok (7.0%) and its Chinese version, Douyin (7.3%) as separate platforms here. Combined, they had 14.3% support, which would have placed them in second place.
All other social platforms took a share of the remaining 26.9%. The most popular of these second-tier social platforms are Twitter (3.2%), FB Messenger (2.4% – another Meta-owned platform), and Telegram (2.2%). This survey excluded (long) video platforms like YouTube.
Instagram Favorite Social Platform for Generation Z and Some Millennials
Instagram is still the most popular social platform for both females (24.4%) and males (24.4%) aged 16-24, although its popularity is waning. It also remains popular with the next generation aged 25-34: females (20.0%), and males (16.3%). Surprisingly, 35-44-year-old females are now most interested in WeChat (16.5%). Is this a sign of a burst in Chinese social media use? Males of this age group prefer WhatsApp (18.4%), but WeChat holds the second position for them.
The older generations all prefer WhatsApp, with considerably more support for this communications app by both males and females by those aged 45+.
We must again observe that GWI has separated TikTok and Douyin in its statistics. If we were to look at the two platforms together, they would hold second place for 16-24 year-old females (18.5% support), and third place for their male counterparts (13.9%). It would also be the second most popular social app for females 25-34 (15.3%), dropping to fourth place for males (13.0%).
Use of Stories Across all Social Media Platforms
Over 406 Million People Use Snapchat Daily
Stories began on Snapchat, and although the platform has never attracted older fans, it remains popular with teenagers. For example, 82 percent of US teens use Snapchat once a month. Overall, it is beloved by Generation Z. In comparison, only 2% of Baby Boomers use Snapchat.
406 million people used Snapchat daily in Q3 2023. They sent more than 5 billion Snaps each day.
About 500 Million People Use Instagram Stories Daily
Instagram may not have invented the Stories format, but they have done much to popularize it. There are now over 500 million people who view Instagram Stories daily, up from 400 million in 2018. Many businesses now post Stories, and US marketers allocate around 31% of their Instagram budget for ads on Stories.
Facebook Stories Has 500M+ Users
Facebook announced in 2019 that it now had 500 million daily active users using Stories on Facebook and Facebook Messenger. Unfortunately, Facebook hasn’t released updated figures since then.
Using Social Media – Statistics Generated by Brandwatch
In this section of the Benchmark Report, we present original research courtesy of Brandwatch, where we compare data from October 2020 to the corresponding period in 2023.
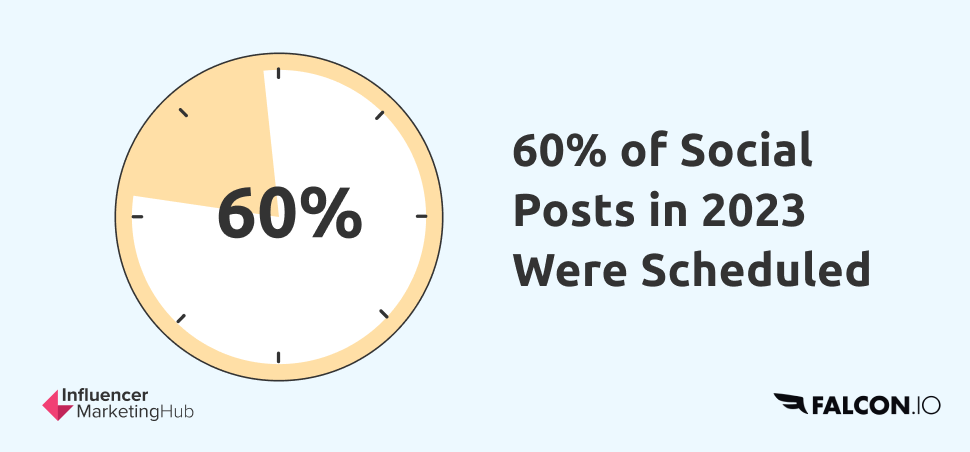
60% of Social Posts are Scheduled in Advance
Brandwatch‘s analysis of over 9 million posts over the last five years revealed that 79% of the 2020 posts were scheduled, with the remaining 21% published in real-time. This was relatively unchanged from the 2019 statistics. However, in 2023, there was a notable shift: 60% of posts were scheduled, while 40% were directly published. This change indicates a growing trend towards more immediate, real-time content sharing in the digital marketing landscape.

More than Half of All Posts are Picture Posts
Brandwatch‘s analysis of the types of posts scheduled and published through its platform shows a continuing trend towards picture posts. In 2023, pictures accounted for 54% of all posts, showing a significant increase from 2019’s 43.96% and 2020’s 46.67%. This growth underscores the enduring appeal and effectiveness of visual content in digital marketing.
The latest data for 2023 also reveals a reshuffle in the popularity of other post types:
- Pictures (54%)
- Videos (15%)
- Link Posts (12%)
- Text (9%)
- Carousels (8%)
While the rankings of post types have seen some changes, the predominance of visual content, particularly single-image picture posts, remains a key strategy in social media marketing.
47% of Posts Made to Facebook
You can use Brandwatch’s platform to make and schedule posts to Facebook, Instagram, LinkedIn, Tumblr, and Twitter. In 2023, people made 47% of these posts on Facebook (up 2% from 2020), 30% on Instagram (up 2%), and 17% on Twitter (down 4%). The use of other platforms like LinkedIn and Tumblr continues, but they account for a smaller percentage of the overall posts.
⅔ of Messages Sent are Private / Direct Messages
One interesting social media benchmark gleaned by Brandwatch was that in previous years, around 66% of social posts were private or direct messages, with the remaining 34% being public posts. However, in 2023, the landscape shifted slightly with 63% of messages being private, and 37% manifesting as public comments. This change reflects a subtle yet noteworthy shift in user behavior towards a more balanced use of private and public communication on social platforms.
The Evolution of Social Post Length
Recent trends in social media have seen a diverse range of post lengths, with a notable shift towards more substantial content, especially on platforms like Instagram, where captions have become increasingly lengthy. Despite Twitter’s expansion of its character limit to 280 a few years ago, it still represents only a fraction of overall social media posts. Interestingly, in 2023, the average character length of posts has stabilized around 326 characters. This trend underscores a balance between concise communication and more detailed storytelling in social media content.
External Sources
Digital 2023: Global Overview Report and Digital 2023: October Global Statshot Review
Data.ai Top Apps & Games Q3 2023 RANKINGS
GWI
Rival IQ 2023 Social Media Industry Benchmark Report
Backlinko
GWI Social Media Marketing Trends in 2023
Statista
The State of Mobile Internet Connectivity Report 2023
Reuters Digital News Report 2023
Business of Apps – Snapchat, Facebook, and TikTok.
Brandwatch (original data)


